


Trend analysis (Fig. 1).
A continuation of the downward movement is possible today with the first target of 1.2972, the support line in a red bold line. In the case of testing, the upward movement with the first target of 1.3044 is a pullback level of 38.2% presented in a red dashed line.
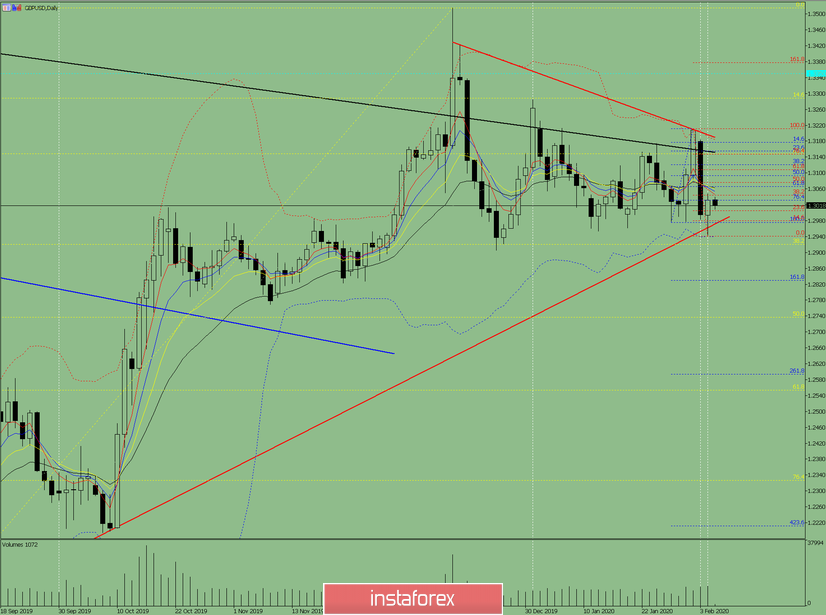
Fig. 1 (daily chart).
Comprehensive analysis:
- Indicator analysis - down;
- Fibonacci levels - down;
- Volumes - down;
- Candlestick analysis - down;
- Trend analysis - down;
- Bollinger Lines - up;
- Weekly schedule - up.
General conclusion:
Today, the price may continue to move down.
An unlikely but quite possible scenario is from the support line 1.2972, presented in a red bold line, work down with the target of 1.2920, the pullback level 38.2% presented in a yellow dashed line.


