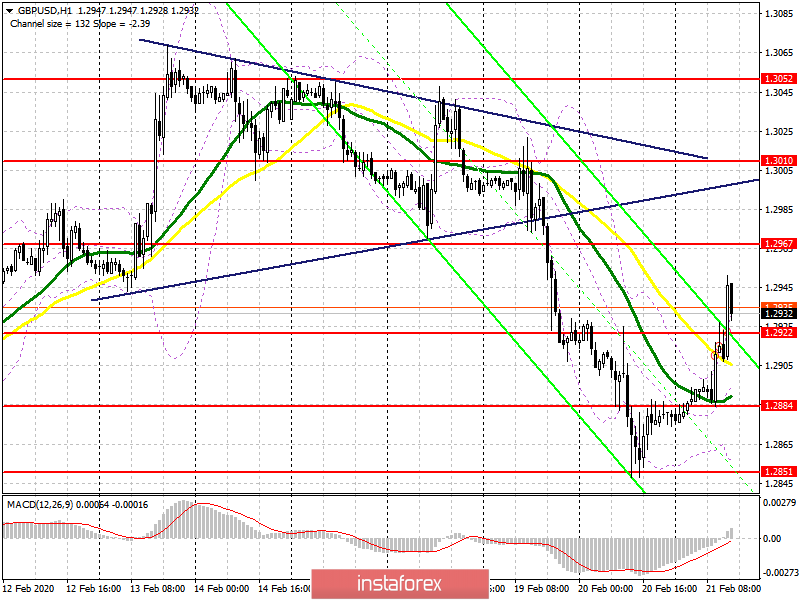
To open long positions on GBPUSD, you need:
If the British pound has been falling all week on the back of good fundamental data on the labor market and retail sales, then weak report on the services sector, on the contrary, returned buyers to the market. The breakthrough of the resistance of 1.2922, which I drew attention to in the morning review, allowed the bulls to build growth in the area of the resistance of 1.2967, which is now their first goal. Fixing above this level will lead to an update of the maximum of 1.3010, where I recommend fixing the profit. In the scenario of a decline in GBP/USD, the formation of a false breakdown at the support level of 1.2922 will signal the opening of new long positions, however, it is best to wait for the release of fundamental data on the American economy. In the event of a breakdown of the above support, I recommend considering new purchases of the pound only for a rebound from the minimum of 1.2884.
To open short positions on GBPUSD, you need:
The bears failed to push the pound below the support of 1.2884, and also failed to protect the resistance of 1.2922. The breakdown of which led to the demolition of a number of stop orders and a sharp rise in GBP/USD in the first half of the day. At the moment, the priority of sellers is the support of 1.2922, under which they need to return the pound. Only good data on manufacturing activity in the US will push GBP/USD below this range and allow the pair to return to the minimum of 1.2884, where I recommend fixing the profit. In the scenario of the pound growth, you can open short positions on a false breakdown from the maximum of 1.2967 or sell GBP/USD from the maximum of 1.3010.
Signals of indicators:
Moving averages
Trading is conducted just above the 30 and 50 daily averages, which indicates another change in the direction of the market in the short term.
Bollinger Bands
If the pair declines, the average border of the indicator around 1.2895 will provide support.

Description of indicators
- Moving average (moving average determines the current trend by smoothing out volatility and noise). Period 50. The graph is marked in yellow.
- Moving average (moving average determines the current trend by smoothing out volatility and noise). Period 30. The graph is marked in green.
- MACD indicator (Moving Average Convergence / Divergence - moving average convergence / divergence) Fast EMA period 12. Slow EMA period 26. SMA period 9
- Bollinger Bands (Bollinger Bands). Period 20


