


EUR/USD – 1H.
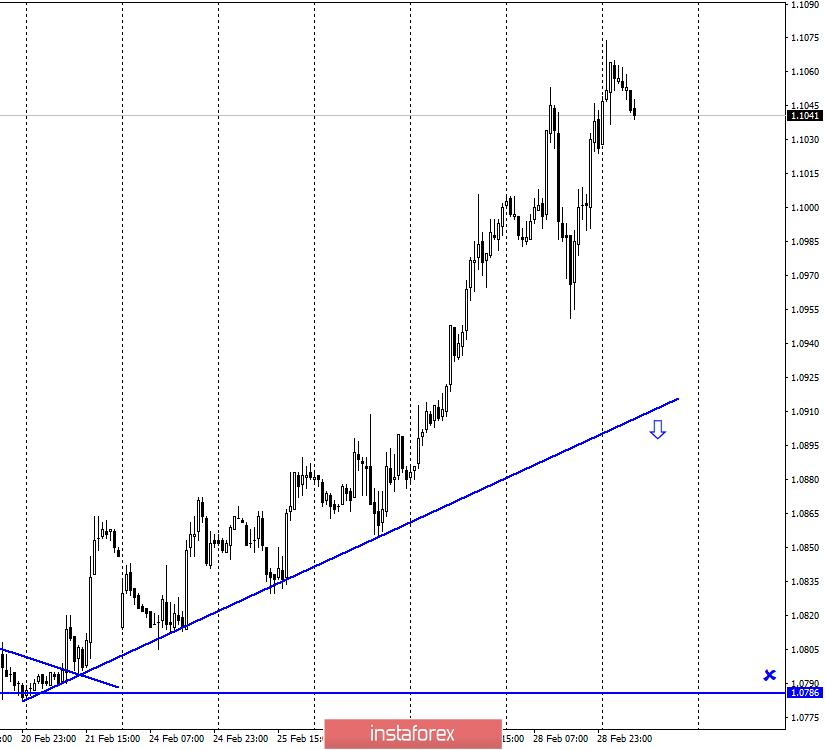
Hello, dear traders. According to the hourly chart, the EUR/USD pair continues rising. The price moved far from the uptrend line which maintains bullish sentiment among traders. Thus, any trade signals on the hourly chart are possible if the pair quotes get back to the uptrend line. Opening of new deals is preferable if the price rebounds or closes below the upward trade line. I do not expect any trade signals on this chart anytime soon.
EUR/USD – 4H.
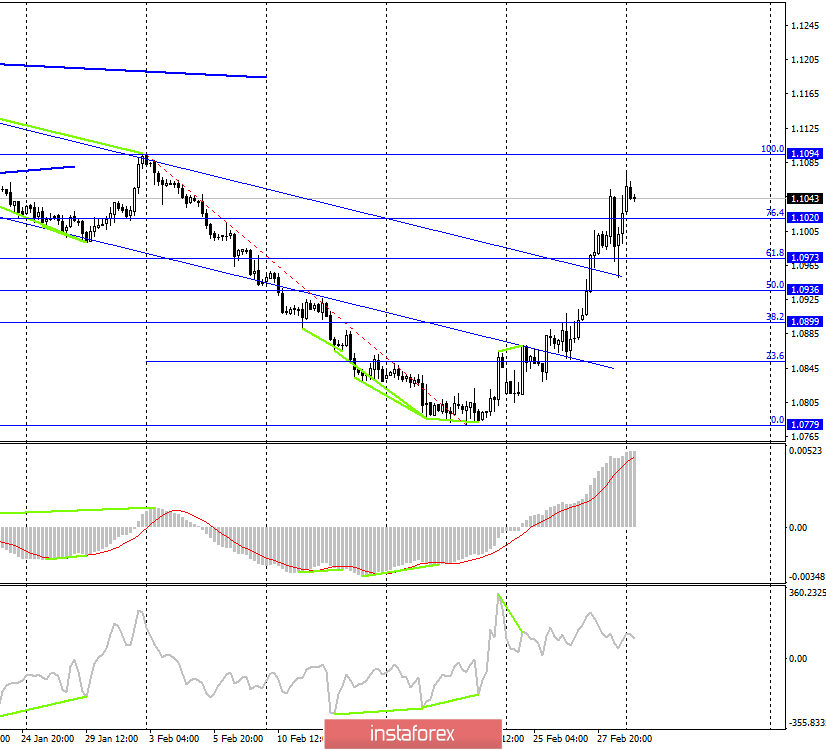
The 4-hour chart indicates that the bullish trend continues. This chart is more informative than the hourly one. The pair consolidated above Fibonacci level of 1.1020 (76.4%), but then it pulled back and fell to the correction level of 1.0973 (61,8%). After that, the pair started growing again to the correction level of 1.1094 (100.0%). However, this Fibonacci grid misses something. If you form the first point based on the peak of December 31, it turns out that the pair corrected exactly by 61.8% at the moment. Therefore, at the current level, the price can pull back as well as quotes can collapse. There is no divergence near any of the indicators.
EUR/USD – Daily.
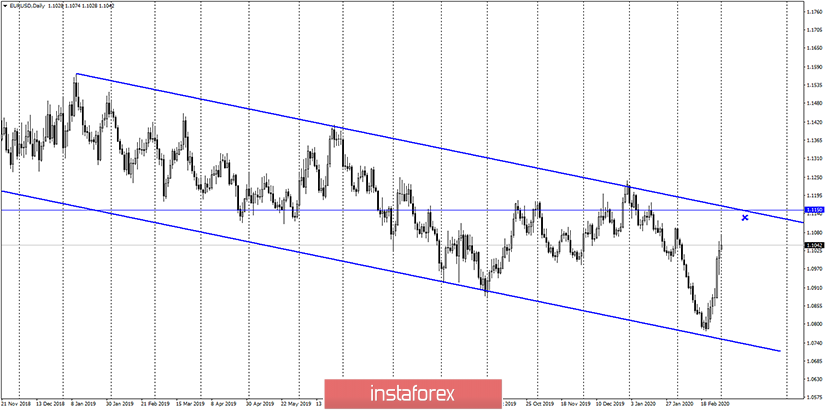
The daily chart indicates that the euro-dollar pair is rising further in the direction of the upper line of the downtrend corridor. As I previously mentioned, the upside potential of the euro on this chart is still limited by the level of 1.1100. It requires only 50 pips for the price to achieve this level. The upside target is 1.1150.
EUR/USD – Weekly.
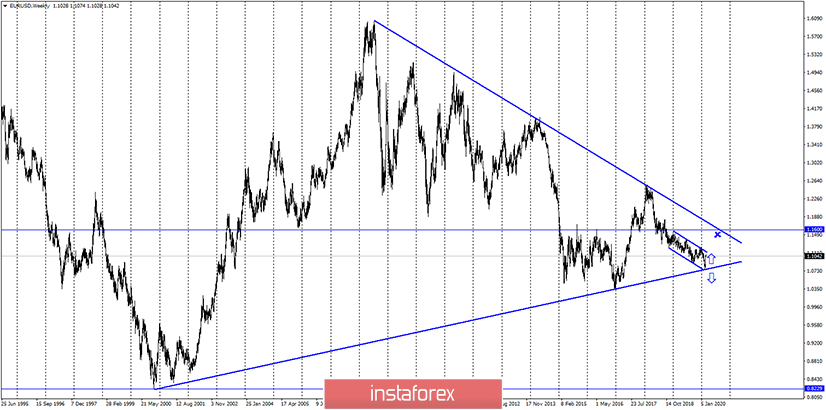
On the weekly chart, the pair quotes rebound from the lower border of the tapering triangle. Thus, the bullish trend is expected to continue, and the price may reach the top line of the the tapering triangle, approximately to the level of 1.1600. However, in order to rise to the top line, the euro-dollar pair is expected to close the daily chart above the downward trend corridor.
News review:
On February 28, Germany released its unemployment (5%) and inflation (1.7% y/y) data. The US presented personal income and spending data (+0.6% m/m and +0.2% m/m). However, these figures were overshadowed by news from the US stock market, which collapsed by several percent at once, as well as concerns over the Fed and a possibility of rate cuts this year. Due to the large influx of data, traders began to panic, which caused strong movements that did not correspond to the data background.
Economic Calendar for US and EU:
Later today, Germany and the EU are set to release their PMI manufacturing data, the IHS Markit US Manufacturing PMI data will see the light, and the ISM PMI Index will be published in the US.
Today, there will be several important news such as business activity in the manufacturing sector of the US, the EU, and Germany. The weak eurozone data and strong US figures may cause a fall in the pair below 61.8% Fibonacci extension.
COT survey (Commitments of traders):
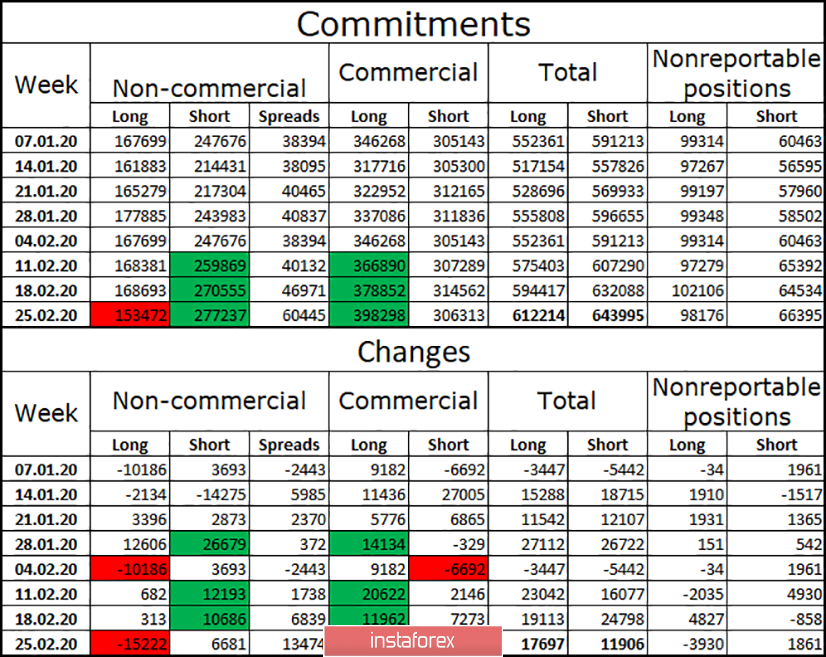
The weekly COT report as of February 25 was published. According to the report, Short positions among speculators declined sharply while Long positions among big corporations surged. It means that Shorts (Total Commitments) start redressing the balance indicating that the downward trend is likely to end. Last week, both Commercials and Non-commercials increased the number of Longs.
Forecast for EUR/USD pair:
According to the daily chart, Long deals are preferable with the targets at 1.1100 and 1.11150. If the quotes pull back from the level of 1.1064, the pair is likely to reverse and fall allowing traders to sell the euro with a short Stop Loss order. If there is no rebound, the price is likely to continue rising.
TERMS:
Non-commercial are major market players: banks, hedge funds, investment funds, private and large investors.
Commercial - commercial enterprises, firms, banks, corporations, companies that buy currency not for speculative profit, but for ensuring current activities or export-import operations.
Non-reportable positions - small traders who do not have a significant impact on the price.


