


Hello, traders!
In this review of the pound/dollar currency pair, we will summarize the results of the February trading session on February 24-28, and also try to determine the future prospects of the GBP/USD pair.
Monthly
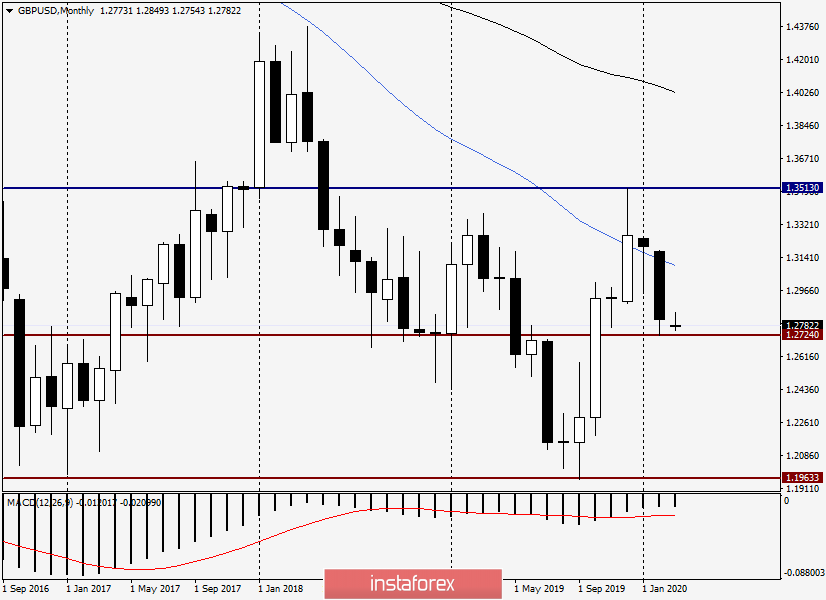
The poor pound continues to weaken across a wide range of the currency market, and the already stale trade agreement between the UK and the European Union helps it do so, which can not be concluded because of a number of insurmountable contradictions. British Prime Minister Boris Johnson rejects the EU's proposals, without offering any compromise option. A compromise is needed since both sides have a certain economic and political weight. You can't play one goal here, it's not the case.
Well, this is a separate topic. Let's go back to the monthly GBP/USD chart, where we see a fairly decent February decline in the pair. Attention is drawn to the 50 simple moving average, above which the quote can not be fixed in any way.
The previous two rather strange and ambiguous candlesticks did not give an idea of the pair's future direction, however, the February trading showed a high probability of a downward scenario. Confirmation of the further decline of the pound will be a census of the minimum values of trading in February at 1.2724. If this happens, the road to the area of 1.2200 will open, however, the monthly chart will not correctly determine any goals, so we will move to lower timeframes.
Weekly
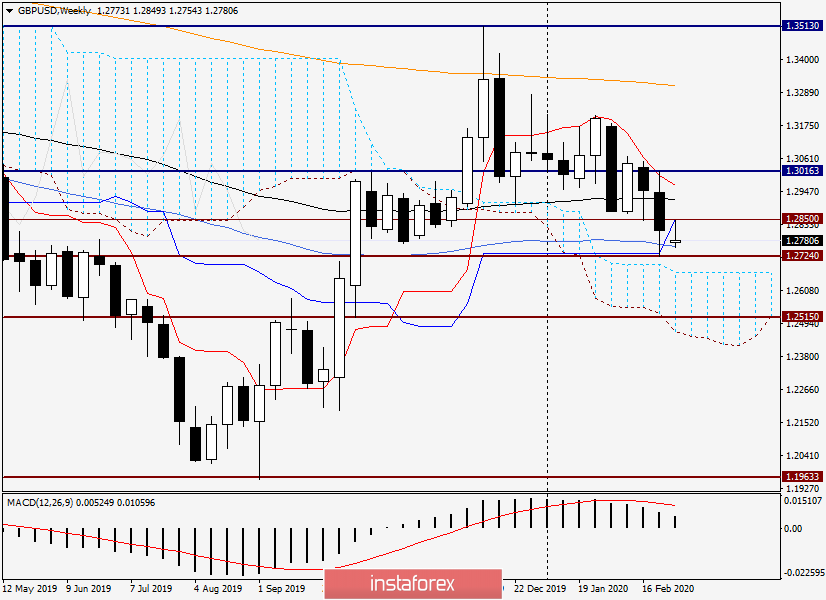
This week opened with a small bearish gap, which was already closed, after which the pair turned again in a southerly direction. If the downward trend continues, the pair will fall to the upper border of the Ichimoku indicator cloud, which passes at 1.2668.
If trading ends within the cloud on March 2-6, the next target for sterling sellers will be the level of 1.2515, the psychological mark of 1.2500, and the lower border of the cloud, which this week passes at 1.2468. Leaving the cloud downwards signals a high probability of a subsequent downward movement to the area of 1.2200.
The bearish scenario will cancel out the return of GBP/USD above the broken support level of 1.2850, as well as the passage of the 89 exponential moving average and the Tenkan line of the Ichimoku indicator. But that's not all. Bulls on the pound will need to raise the quote above the psychological level of 1.3000, then overcome the resistance of sellers at 1.3016.
So far, trading is under the control of bears, although 50 MA is trying to support the price. However, it is not a fact that it will be possible to do this. However, the weekly auction has just opened, and we still have a lot of interesting things to see. Due to important events in the economic calendar, changes may occur in the price dynamics of the pair, possibly drastic. And news about the trade agreement between the UK and the EU will no doubt affect the rate of the pound sterling. I do not exclude that the pair may find strong support in the price zone of 1.2724 1.2670 and turn on the rise, but for this, both macroeconomic statistics and the external background should be on the side of the British currency.
Daily
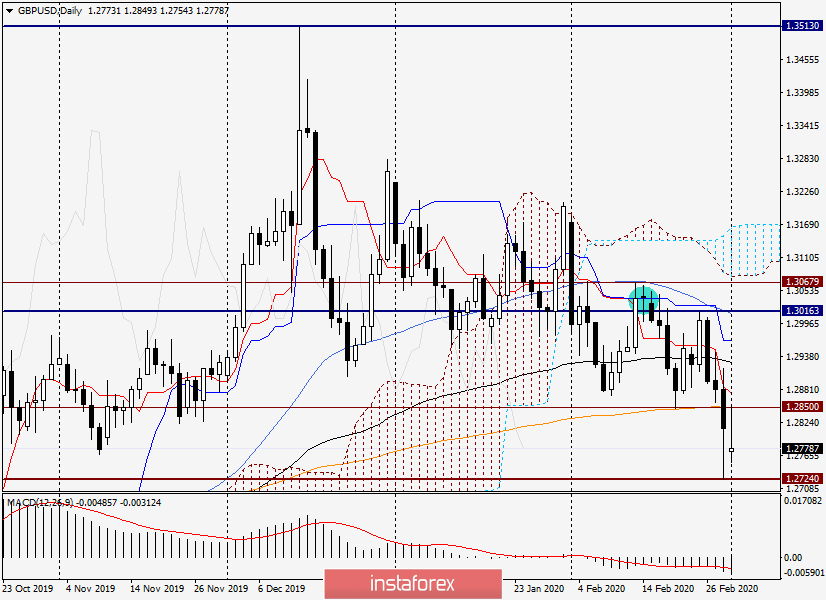
On the daily chart, a Friday candle with a long lower shadow just indicates the probability of an upward turn, but if the Friday lows of 1.2724 are rewritten and the trading session closes below this mark, the chances of growth will become much weaker.
As for the resistances, along with the mark of 1.2850, the growth is restrained by the 200 EMA, which is located right there, so the bulls for the pound should first close the daily trading above 1.2850 and 200 exponents. Only then can we expect growth to 1.2873, where the Tenkan is located, to 1.2928 (89 EMA) and to 1.2966, where the Kijun line is located.
At the end of the review, the pair is more focused downwards, but much will depend on the ability to break through the support of 1.2724.
Conclusions and recommendations.
Judging by the time intervals considered in this review, a downward scenario is most likely for the GBP/USD pair. If this assumption is correct, we are preparing for sales after corrective rollbacks to 1.2830, 1.2850, 1.2900 and, possibly, after the rise in the price zone of 1.2930-1.2970. I recommend looking for confirmation signals in the form of corresponding models of Japanese candlesticks on the four-hour and (or) hourly charts.
Success!


