


Hello, colleagues!
Yesterday, the EUR/USD currency pair continued its upward movement. At the same time, it turned out to be quite significant.
Before proceeding to the technical picture, I will highlight the macroeconomic data that can influence the price dynamics of the main currency pair of the Forex market.
The eurozone will provide data on the consumer price index today, and reports on retail sales will be released tomorrow. No more important and significant indicators will be published.
In the US, the most important event will be the report on the labor market. As usual, the market participants will pay the most attention to the creation of new jobs in non-agricultural sectors of the economy (Nonfarm Payrolls), the unemployment rate and the growth of the average hourly wage.
I believe that nonfarm will have the biggest impact on the course of weekly trading and the pair is irrepressibly eager to go up.
Daily
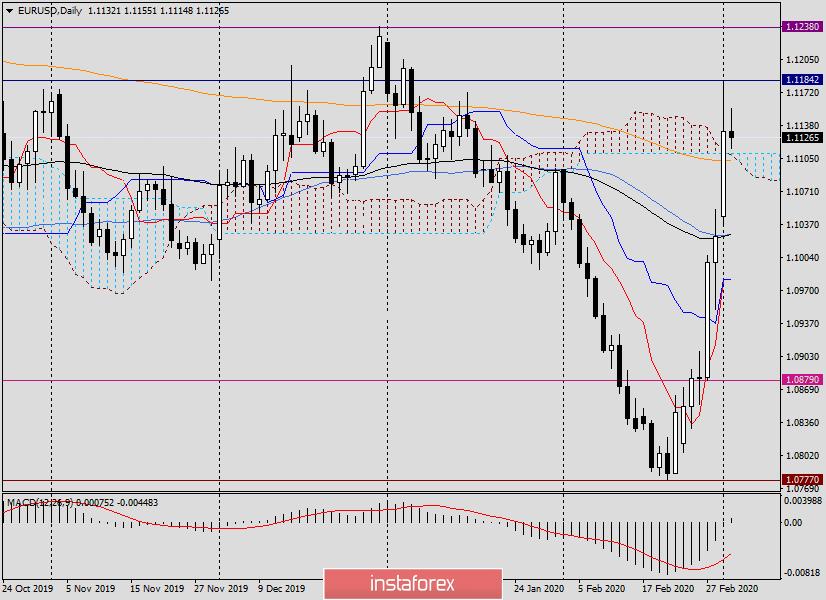
As a result of yesterday's strong growth, the 200 exponential moving average was passed and the Ichimoku indicator cloud was literally stitched up from the bottom
The maximum values of the Monday session were shown at 1.1184, after which the pair retreated and finished trading at 1.1132. The upper shadow of yesterday's candle was quite impressive. At the time of writing, the pair was rising to 1.1155 but turned around from this mark and is now trading near 1.1125. It is possible that the euro/dollar is adjusted to the previous growth, and in this case, we can expect a pullback to the 200 exponential broken the day before, which is at 1.1103. I assume that from here we can consider opening long positions on euro/dollar, and we will look for confirmation of this idea at lower time intervals.
H4
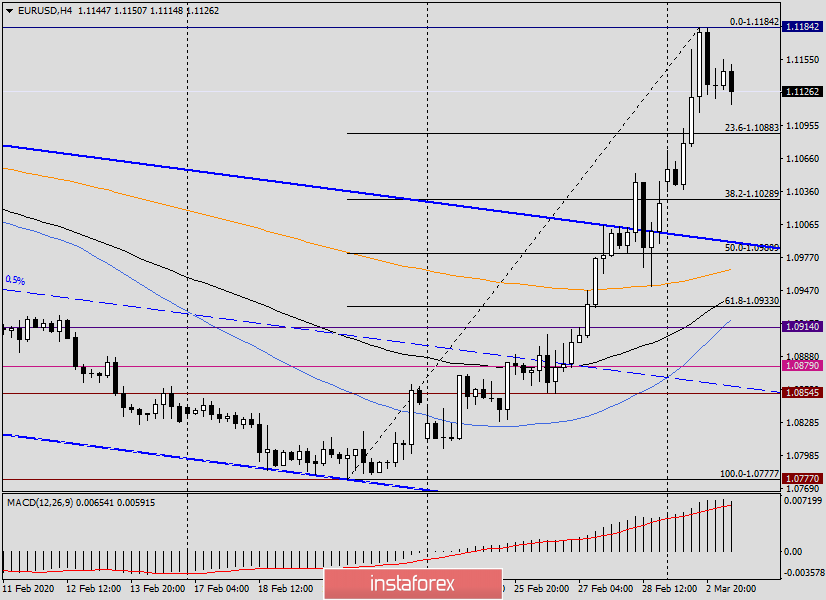
On this chart, I stretched the grid of the Fibonacci instrument to the growth of 1.0777-1.1184. As I have repeatedly expressed my opinion, after such strong price movements, the correction is often limited to the first pullback level of 23.6. If this assumption is correct, then taking into account the daily 200 EMA, the price zone for potential purchases can be defined as 1.1103-1.1088.
With a deeper corrective pullback, the euro/dollar will fall to the Fibo levels of 38.2 and 50.0. However, here we need to carefully monitor the situation on the market. This may be a turning point. In yesterday's review, I marked the price zone of 1.1178-1.1238 as very strong and difficult to pass. As you can see, having risen in this area, the pair turned to a decline, which at the moment is more likely to be corrective.
H1
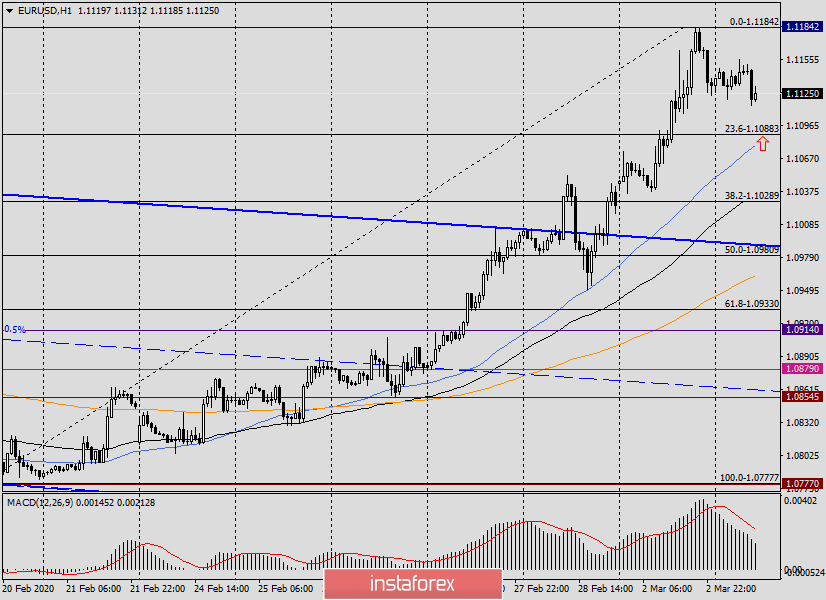
On the hourly chart, the correction rollback option is confirmed. After the appearance of the two Doji candles, it became clear that the growth can hardly be continued from the current values, and some adjustment of the exchange rate is necessary.
It is worth noting that under the level of 23.6 Fibo, there is a 50 simple moving average, which can also provide good support for the quote.
Thus, the area for possible purchases, taking into account the location of 50 MA, should be slightly changed and designated as 1.1103-1.1080. Once again, I note that the correction should not be deep and the pair can resume the rise from the current values. At the end of this article, such attempts are observed.
Conclusion and trading recommendations.
In my opinion, there is a high probability that the upward movement will continue, which means that the main trading idea for euro/dollar remains purchases. You can aggressively and risky try to buy from the current prices (1.128). It is less risky to buy the euro/dollar after a corrective pullback to the price zone of 1.1103-1.1080. Those who use a breakout strategy can try to buy on the breakout of yesterday's highs of 1.1184, but in this case, it is necessary to remember that the strong levels of 1.1200, 1.1223 and 1.1238 are above, where the pair may meet serious resistance and turn down.
Regarding sales, you need to wait for the characteristic candle signals in the area of 1.1150-1.1180 or higher, near the listed levels. In any case, before opening short positions, you should see confirmation in the form of appropriate signals. Position against the current and fairly strong upward trend.
Good luck!


