


EUR/USD
Analysis:
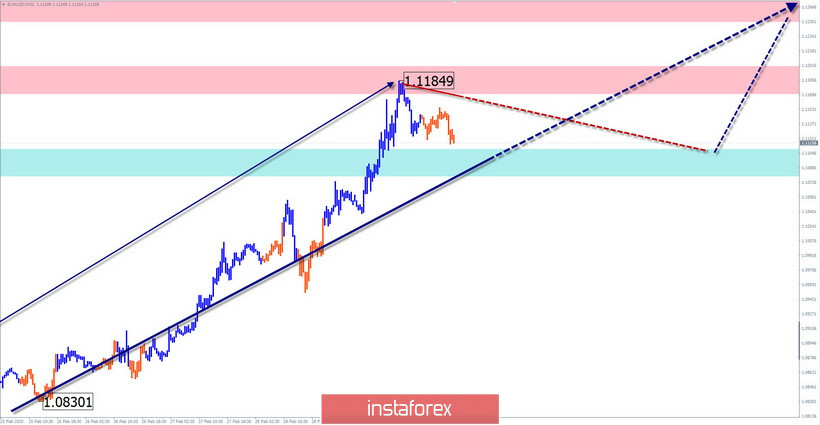
By coincidence of several signs at once, we can understand that the previous bearish wave of the euro is completed. The ascending section that started on February 20 has a high wave level. The weekly chart shows the change in the direction of the medium-term trend.
Forecast:
Despite the pronounced impulse nature of the movement, we should expect a corrective pullback from the current intermediate level today. Most likely, the decline will last no further than the support zone. Next, we expect a return to the bullish mood of the price movement.
Potential reversal zones
Resistance:
- 1.1170/1.1200
- 1.1250/1.1280
Support:
- 1.1110/1.1080
Recommendations:
In the coming days, sales of the European currency can be very risky. Therefore, it is not recommended. The main attention is given to searching for buy signals at the ends of counter-movements. The potential for the expected growth of the rate is estimated by the boundaries of the far resistance zone.
AUD/USD
Analysis:
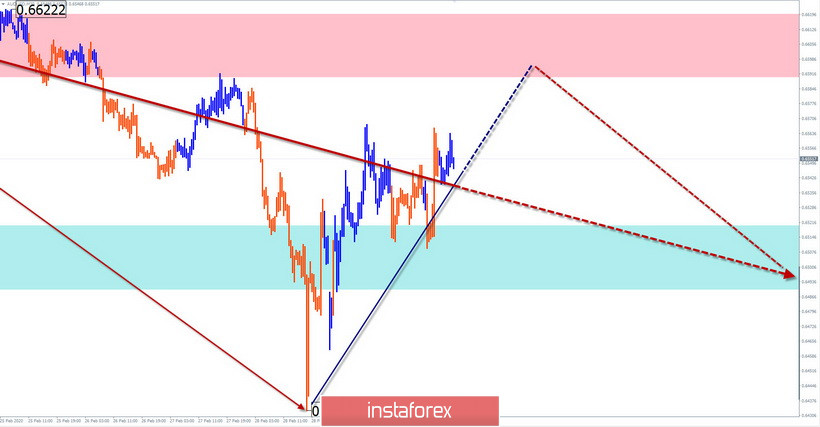
On all scales of the Australian currency chart, the bearish trend continues to dominate. Short-term price fluctuations are an exception. Since February 28, quotes have been rolling back up from the intermediate support.
Forecast:
In the upcoming trading sessions, the general sideways mood of the movement is expected. In the first half of the day, an upward vector is possible. The price rise is expected no further than the calculated resistance. You can expect to return to the downward rate no earlier than tomorrow.
Potential reversal zones
Resistance:
- 0.6590/0.6620
Support:
- 0.6520/0.6490
Recommendations:
The upward movement of the price contradicts the main trend rate, so purchases of the pair are possible only in "pipsing" transactions. We recommend that you focus on searching for sell signals at the end of the current correction.
GBP/JPY
Analysis:
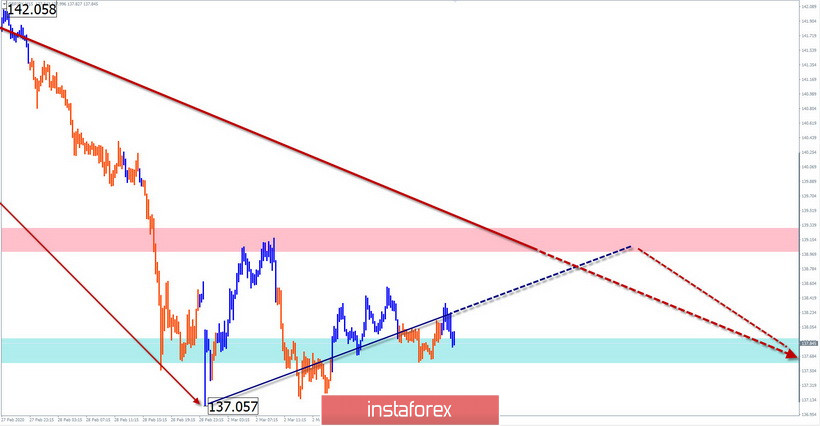
On the pair's chart, the downward wave from December 13 has now reached the upper limit of the preliminary completion zone. The wave structure looks formed. The proportions of the wave parts are observed. The price rise that started 2 days ago does not yet have a reversal potential.
Forecast:
In the coming day, the price of the pair expects a "sideways". The borders of the corridor are the nearest counter zones. Before the start of price growth, there may be pressure on the support zone with a puncture of its lower border.
Potential reversal zones
Resistance:
- 139.00/139.30
Support:
- 137.90/137.60
Recommendations:
Sales of the instrument remain in priority until the reversal signals appear. Purchases are possible today, however, the lot should be reduced as much as possible.
Explanations: In the simplified wave analysis (UVA), waves consist of 3 parts (A-B-C). The last incomplete wave is analyzed. The solid background of the arrows shows the formed structure and the dotted background shows the expected movements.
Note: The wave algorithm does not take into account the duration of the tool's movements in time!


