


Hello, traders!
The dollar/yen currency pair showed an impressive downward movement in trading from February 24 to 28. Against the background of the spread of the coronavirus epidemic, the demand for the Japanese currency as a protective asset has increased significantly.
At the current five-day trading session, the pair is trying to adjust to the previous strong decline. Let me remind you that the main event that will affect the results of weekly trading will take place on Friday when data on the US labor market for the month of February will be published.
In the meantime, let's move on to the technical picture that is observed for the USD/JPY currency pair, and start with the weekly chart.
Weekly
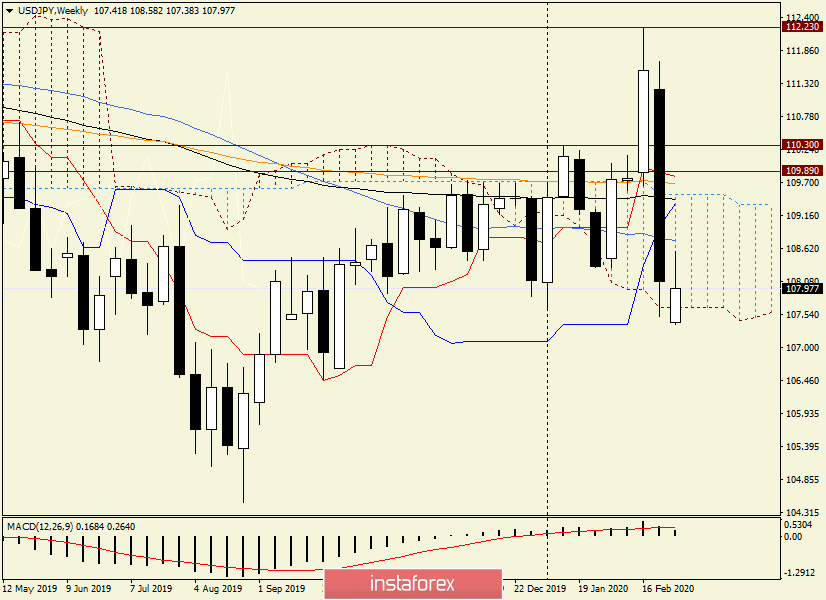
What happened in the last five days of the auction is difficult to call a decline. This is the real fall. During the downward dynamics, the pair returned to the previously broken resistance levels of 110.30 and 110.00, fell under the Tenkan line of the Ichimoku indicator, 144 and 89 exponential moving averages, the Kijun line, and 50 MA.
In general, everything that was possible was passed down, and there were even attempts to bring the price down from the Ichimoku cloud and close the auction there. However, the USD/JPY bears did not cope with the last task, and the weekly session ended within the Ichimoku cloud.
At this week's auction, attempts were again made to get down out of the cloud, however, they are unsuccessful again. The pair has already risen to the level of 108.58. However, they met strong resistance there, rolled back down, and is trading near 107.95. At the same time, the shadow left at the top gradually increases. However, around the strong technical level of 108.00, the struggle of the opposing sides can still unfold. Let's see what the picture is in smaller time intervals.
Daily
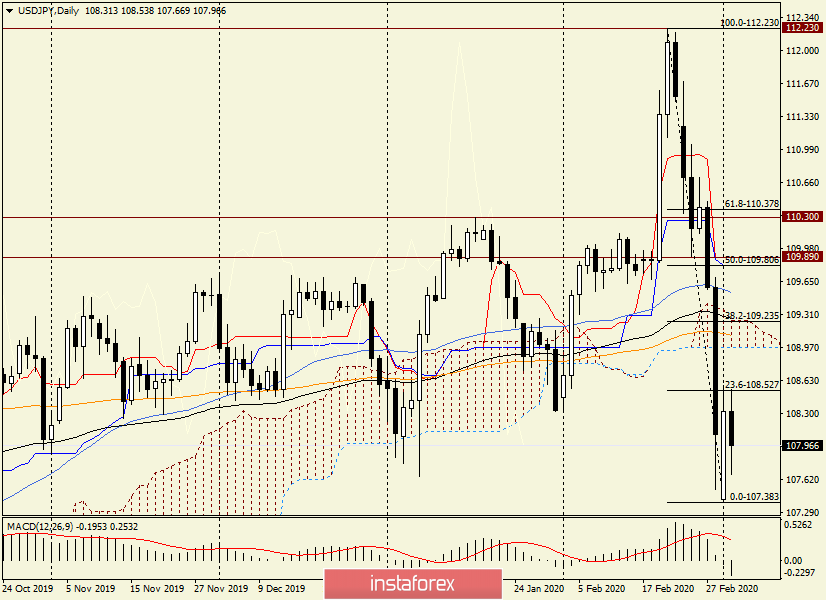
According to the daily chart, I stretched the Fibonacci grid for a fall of 112.23-107.38. As you can see, the pair has already corrected the first pullback level of 23.6, where it met quite serious resistance.
I have repeatedly noted that after such strong movements, the corrective pullback is most often limited to the first level of 23.6. However, it is necessary to consider other options, with a deeper correction.
In this scenario, the 38.2 Fibo level is highlighted, slightly below which the lower border of the Ichimoku indicator cloud passes, and right at 38.2 the upper border of the same cloud and the 89 exponential moving average.
Technically, the price zone of 108.97-109.23 looks very good for opening short positions on the USD/JPY pair. Especially given Friday's data on the US labor market, sharp and strong movements in each direction are quite possible. In this regard, the price flight to the area of 109.00 is very likely.
Judging by the daily chart, less attractive prices for sales can be found when rising to the level of 108.60. However, this will require confirmation in the form of bearish candlestick patterns on smaller timeframes.
H1
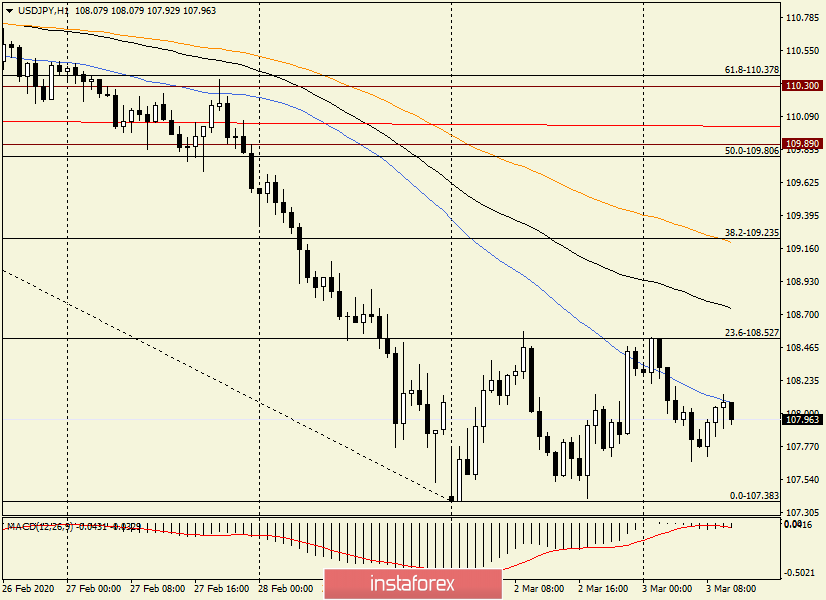
On the hourly chart, the 50 simple moving average provides resistance to growth attempts. If the USD/JPY bulls are unable to pass this moving up, the pair may resume its decline from the current prices. In this case, traders at the breakdown of levels can try to open positions for sale at the breakdown of the support of 107.38.
However, in my personal opinion, it is better to wait for sales of more attractive prices, which can be 108.50, 108.75 and 109.20.
Purchases are more risky, since they are corrective in nature and can give way at any time to sales, which are the main trading idea for the dollar/yen pair.
Good luck!


