


GBP/USD
Analysis:
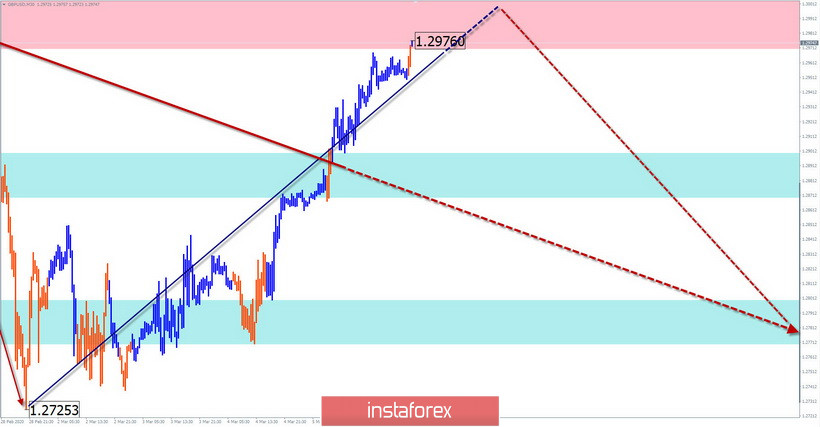
The direction of short-term fluctuations in the pound is set by the descending wave algorithm from December 13. The first parts (A-B) are formed in its structure. Over the past week, the price formed a correction in the last part (C). The lower limit of the preliminary zone of potential reversal has been reached.
Forecast:
In the coming trading sessions, it is expected that the price rise will be completed, a reversal will be formed, and the price decline will begin. The time of the reversal can be linked to the time of the release of important news blocks from the United States. A change in direction may be accompanied by a sharp increase in volatility.
Potential reversal zones
Resistance:
- 1.2970/1.3000
Support:
- 1.2900/1.2870
- 1.2800/1.2770
Recommendations:
Purchases of the pound in the near future is not advisable. We recommend that you focus on finding sales signals.
USD/JPY
Analysis:
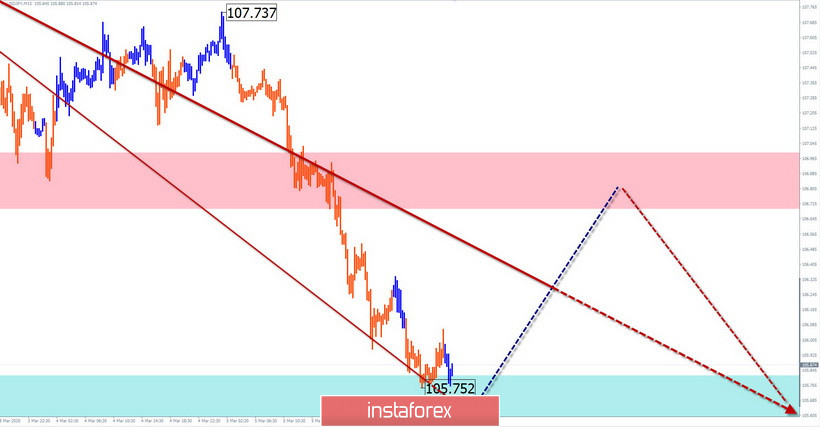
As a result of the rapid price decline of the main pair, the Japanese yen has significantly strengthened against the US currency over the past 2 weeks. The formed wave has a strong reversal potential. By now, the price has reached the upper limit of the strong support zone.
Forecast:
It is unlikely that the current support level can be broken without a correction. In the coming days, you can expect a rise in the price rate. Today, we expect the formation of a reversal and the beginning of the price move up.
Potential reversal zones
Resistance:
- 106.70/107.00
Support:
- 105.80/105.50
Recommendations:
Selling the yen today can be risky. It is recommended to refrain from trading during the upward trend and look for sell signals at the end of it. Intraday supporters can make short-term purchases of the tool with a reduced lot.
USD/CHF
Analysis:
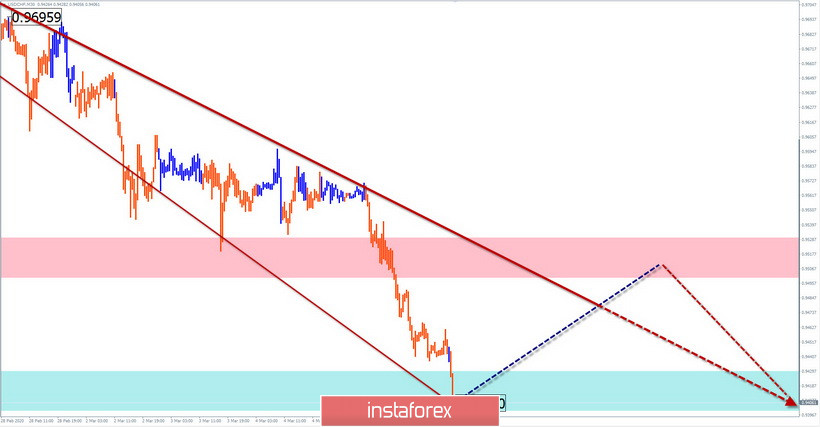
The Swiss franc chart is dominated by a bearish trend sentiment. The wave started in April last year. Its last section started on February 20. The price has reached the upper limit of the intermediate support zone.
Forecast:
It is likely that the current zone can give rise to a counter price correction. The decline is expected to be completed in the next sessions. At least the pair expects a "sideways" today. An upward vector is possible. When changing the course, a puncture of the lower support zone is not excluded.
Potential reversal zones
Resistance:
- 0.9500/0.9530
Support:
- 0.9430/0.9400
Recommendations:
The dominant trend direction makes the sale of the franc promising. In the coming day, trading on the pair's market can be very risky and lead to losses. It is wiser to refrain from entering into transactions. In the area of the resistance zone, it is recommended to track emerging sell signals.
Explanations: In the simplified wave analysis (UVA), waves consist of 3 parts (A-B-C). The last incomplete wave is analyzed. The solid background of the arrows shows the formed structure and the dotted background shows the expected movements.
Note: The wave algorithm does not take into account the duration of the tool's movements in time!


