


Trend analysis (Fig. 1).
Today, from the level of 1.3049 (closing of the Friday afternoon candle), upward movement is possible with the target at the resistance line 1.3145 (black bold line). From this line, work down with the target of 1.3084, a retracement level of 14.6% (blue dashed line).
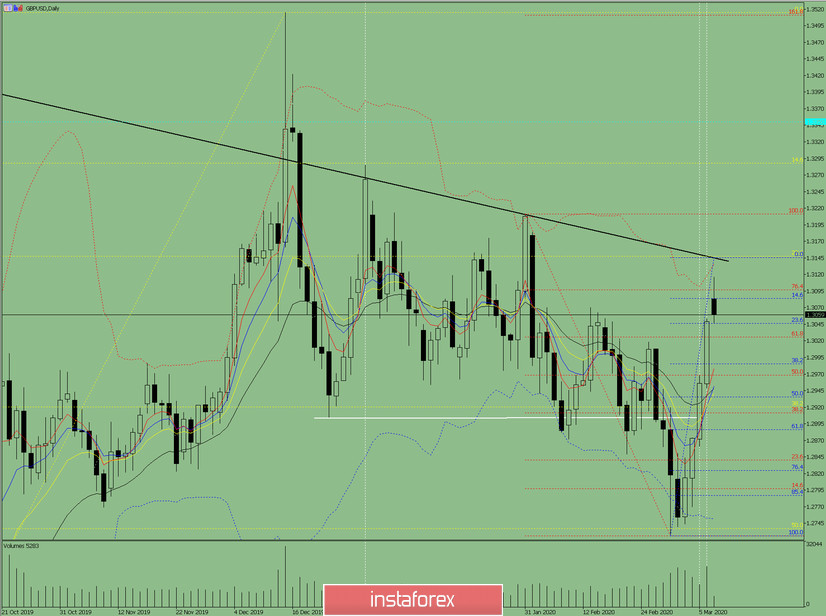
Fig. 1 (daily chart).
Comprehensive analysis:
- Indicator analysis - up;
- Fibonacci levels - up;
- Volumes - up;
- Candlestick analysis - the top;
- Trend analysis - down;
- Bollinger Lines - up;
- Weekly schedule - up.
General conclusion:
Today, the price may continue to move up.
An unlikely scenario is from a pullback level of 23.6% equivalent to 1.3046 (blue dashed line), work down with the target of 1.2985, a pullback level of 38.2% (blue dashed line).


