


Trend analysis.
This week, the price will move up with the target of 1.1665, a pullback level of 50.0% (blue dashed line). Upon reaching this target, it is possible to continue working upwards with the target at resistance line 1.1835 (black bold line).
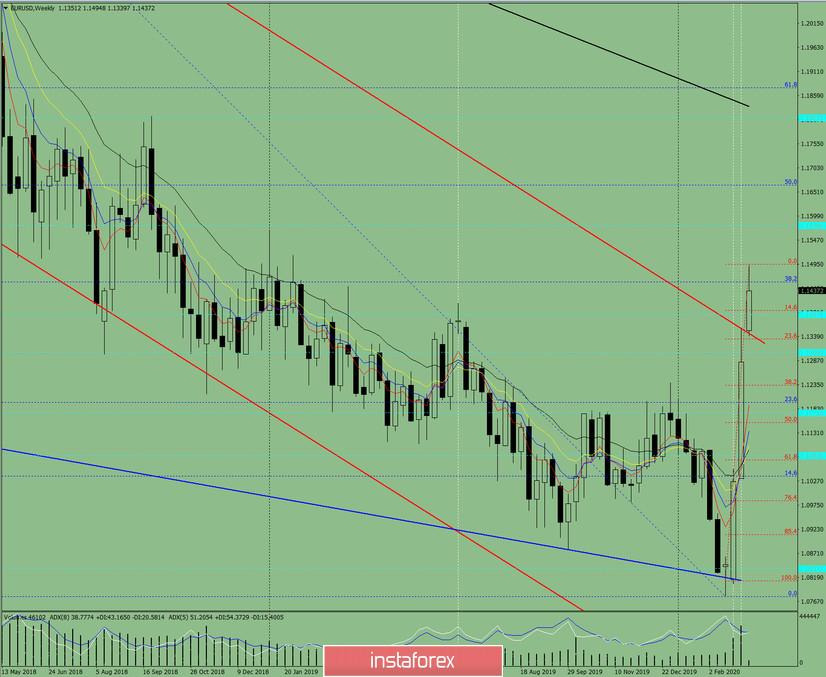
Fig. 1 (weekly schedule).
Comprehensive analysis:
- Indicator analysis - up;
- Fibonacci levels - up;
- Volumes - up;
- Candlestick analysis - down;
- Trend analysis - up;
- Bollinger Lines - down;
- Monthly chart - up.
The conclusion of the comprehensive analysis is the upward movement.
The overall result of calculating the candle of the EUR / USD currency pair according to the weekly chart: the price for this week is more likely to have an upward trend, with the absence of the first lower shadow of the weekly white candlestick (Monday - up) and the absence of the second upper shadow (Friday - up).
An unlikely lower scenario: from a retracement level of 14.6% equivalent to 1.1395 (red dashed line), movement down with a lower target of 1.1234, a retracement level of 38.2% (red dashed line).


