


Trend analysis:
This week, the price may continue to move up with the goal of reaching the resistance line - 1. 3139 (black bold line) and if this line is reached, it will most likely continue to work up with the target 1.3313, which is a pullback level 76.4% (red dashed line).
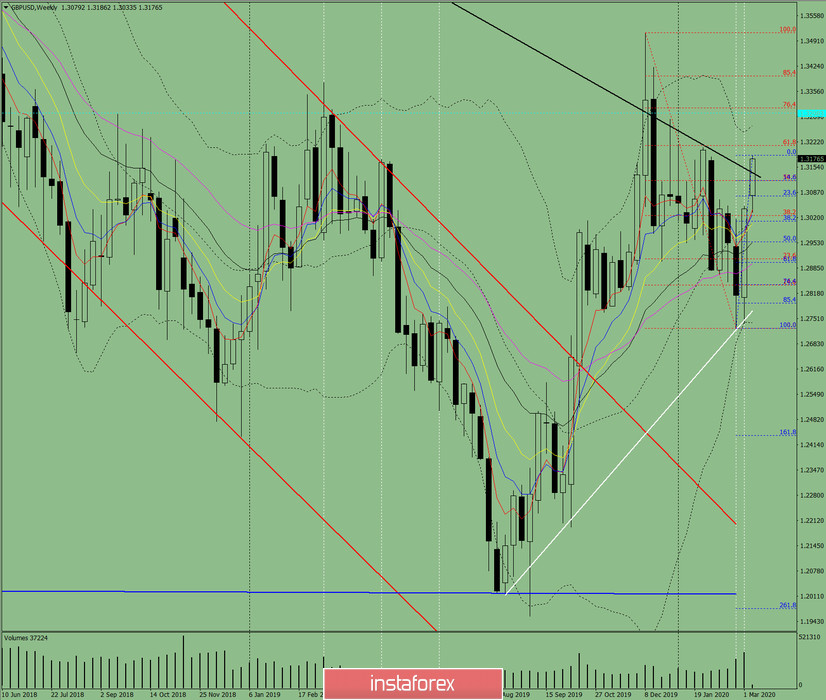
Fig. 1 (weekly schedule).
Comprehensive analysis:
- indicator analysis - up;
- Fibonacci levels - up;
- volumes - up;
- candlestick analysis - up;
- trend analysis - up;
- Bollinger Lines - up;
- monthly chart - up.
The conclusion of a comprehensive analysis is the upward movement.
The overall result of calculating the candle of the GBP / USD currency pair according to the weekly chart: the price will most likely have an upward trend for weeks with the absence of the first lower shadow of the weekly white candlestick (Monday - up) and the presence of the second lower shadow (Friday - down).
The first upper target is 1. 3313 - the pullback level of 76.4% (red dashed line).
An unlikely lower scenario: work down with the first target of 1.3009 - pullback level 38.2% (blue dashed line) from the resistance line - 1.3139 (black bold line).


