


To open long positions on EURUSD, you need:
From a technical point of view, nothing much has changed. In the first half of the day, euro buyers made an attempt to return the resistance to 1.1340, but it did not go very smoothly, which again led to the pair falling below this level and kept control on the side of the bears. Data on inflation in the United States did not significantly affect the market situation. At the moment, the bulls still need a breakdown and consolidation above the resistance of 1.1340, which will strengthen their positions and lead to an update of the highs of 1.1390 and 1.1422, where I recommend fixing the profits since large sellers will start operating in this area. In the scenario of a further decline in EUR/USD in the second half of the day, it is best to return to long positions only on a false breakdown in the support area of 1.1279, since confidence in this level is much less than yesterday or buy the pair immediately on a rebound from the lows of 1.1239 and 1.1195.
To open short positions on EURUSD, you need:
The bears managed to form a false breakdown in the resistance area of 1.1340, which I paid attention to in my morning forecast, which keeps the market under their control. At the moment, sellers are focused on returning and fixing under the support of 1.1279, which will increase the pressure on the pair and lead to the update of new local lows in the area of 1.1239 and 1.1195, where I recommend fixing the profits. However, given the weak data on inflation in the US, it is unlikely that demand for the US dollar will continue without the support of major players. If the bulls again manage to tighten the pair to the level of 1.1340, I recommend returning to short positions in this scenario only after the resistance test of 1.1390 or a rebound from the larger level of 1.1422.
Signals of indicators:
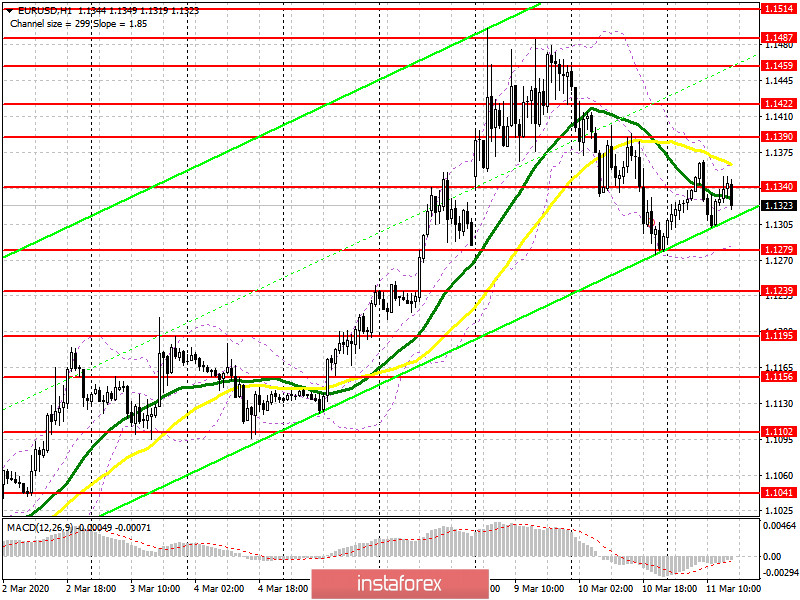
Moving averages
Trading is conducted just below the 30 and 50 moving averages, which indicates that the correction potential remains in the second half of the day.
Bollinger Bands
In the event of a further decline in the euro, the lower border of the indicator around 1.1279 will provide support, while a breakdown of the upper border of the indicator around 1.11365 will lead to a larger upward trend.
Description of indicators
- Moving average (moving average determines the current trend by smoothing out volatility and noise). Period 50. The graph is marked in yellow.
- Moving average (moving average determines the current trend by smoothing out volatility and noise). Period 30. The graph is marked in green.
- MACD indicator (Moving Average Convergence / Divergence - moving average convergence / divergence) Fast EMA period 12. Slow EMA period 26. SMA period 9
- Bollinger Bands (Bollinger Bands). Period 20


