


To open long positions on GBPUSD, you need:
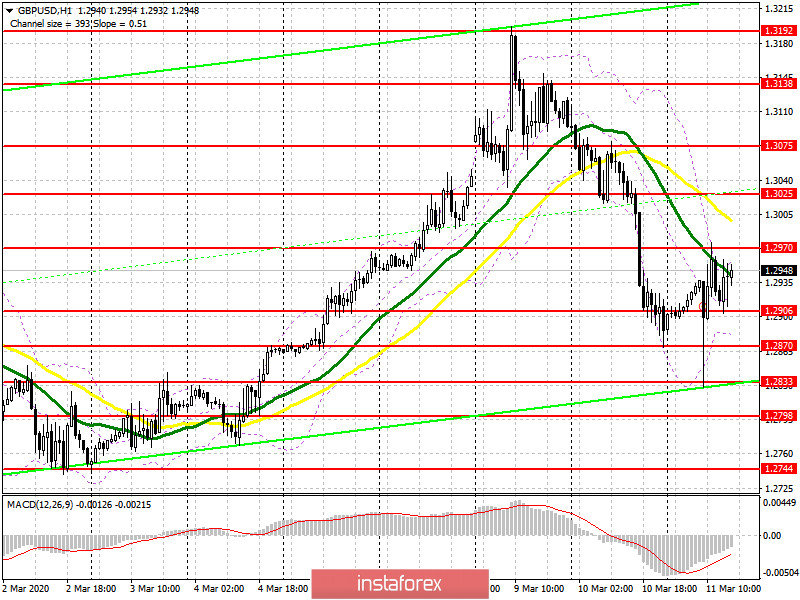
The sharp fall in the pound in the first half of the day was due to an unscheduled reduction in interest rates by the Bank of England to 0.25%. However, the market very quickly played back this decision with new purchases, which indicates that there are large players betting on the growth of the pound in the medium term. In the morning review, I recommended opening long positions from the support of 1.2833, and now the bulls need to focus on breaking through and fixing above the resistance of 1.2970, which will preserve the upward potential, and will lead to an update of the highs of 1.3025 and 1.3075, where I recommend taking the profits. In the scenario of a repeated decline in GBP/USD in the second half of the day to the area of 1.2906, it is best to abandon long positions until the update of the lows of 1.2870 and 1.2833, the breakthrough of which can cause a lot of problems for buyers
To open short positions on GBPUSD, you need:
Sellers protect the resistance of 1.2970, and the repeated formation of a false breakdown on it will be a direct signal to open short positions, which may lead to a decrease in the pound to the support area of 1.2906, where I recommend taking the profits. However, a more important task for the future will be to break this range, which will return the market to bearish momentum and lead to an update of the lows of 1.2870 and 1.2833. If the bears do not "rest" in the resistance area of 1.2970 in the second half of the day, then it is best to postpone short positions until the test of the highs of 1.3025 and 1.3075, from where you can sell immediately for a rebound in the calculation of 20-30 points of a downward correction inside the day.
Signals of indicators:
Moving averages
Trading is conducted below the 30 and 50 daily averages, which indicates that the downward correction potential remains.
Bollinger Bands
A break of the indicator's middle border at 1.2925 will increase pressure on the pound. A break of the upper border in the area of 1.2960 will lead to a new wave of GBP/USD growth.
Description of indicators
- Moving average (moving average determines the current trend by smoothing out volatility and noise). Period 50. The graph is marked in yellow.
- Moving average (moving average determines the current trend by smoothing out volatility and noise). Period 30. The graph is marked in green.
- MACD indicator (Moving Average Convergence / Divergence - moving average convergence / divergence) Fast EMA period 12. Slow EMA period 26. SMA period 9
- Bollinger Bands (Bollinger Bands). Period 20


