


GBP/USD
Analysis:
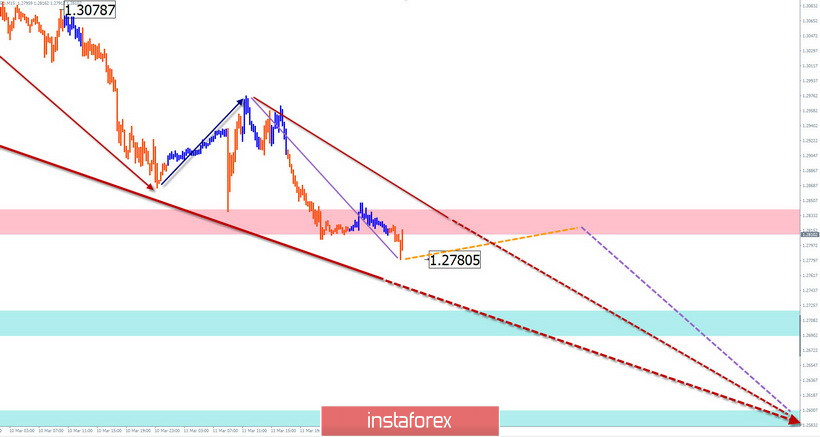
The direction of the short-term trend of the British pound is set by the downward wave from December 13. In the wave, the first parts (A-B) are completed. The bearish section that began on March 9 gave rise to the final part (C). The wave has a pronounced pulse form. There are about 2 price figures to the upper border of the nearest support zone for a large TF.
Forecast:
The pound is expected to continue to decline in the next trading sessions. Oncoming traffic will be short-lived, most likely in the form of a sideways flat.
Potential reversal zones
Resistance:
- 1.2810/1.2840
Support:
- 1.2720/1.2690
- 1.2600/1.2570
Recommendations:
Purchases of British currency in the coming days will not be relevant. At the end of all oncoming traffic, it is recommended to track sales signals.
USD/JPY
Analysis:
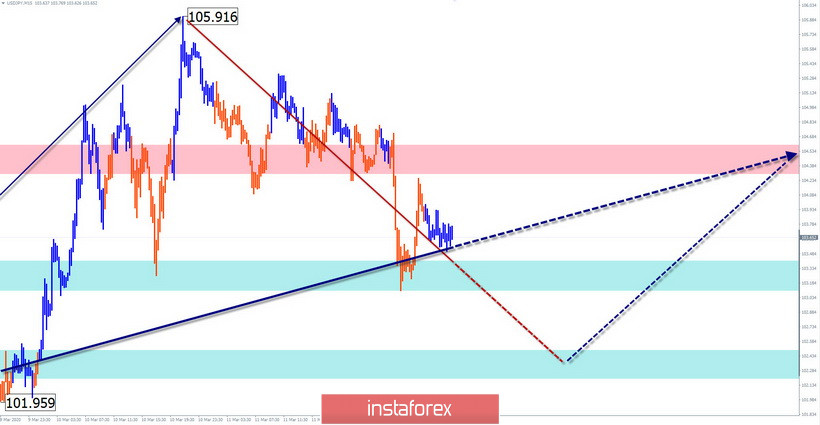
On the chart of the Japanese yen, the bearish wave from February 20 ended. On March 9, a new upward wave began to form. It has a powerful potential that allows you to wait for the continuation of the beginning of the rise and the formation of at least a correction of the previous section.
Forecast:
The scope of the current price correction in recent days can bring quotes to the far support zone. Today, we expect a downward vector of the pair's movement, up to the full completion of the decline. Then you should wait for a reversal and the beginning of an intensive price growth rate.
Potential reversal zones
Resistance:
- 104.30/104.60
Support:
- 103.40/103.10
- 102.50/102.20
Recommendations:
In the upcoming trading sessions, the safest tactic is to stay out of the market. At the end of the current decline, it is recommended to track signals and reversals to enter long positions on this instrument.
Explanation: In the simplified wave analysis (UVA), waves consist of 3 parts (A-B-C). The last incomplete wave is analyzed. The solid background of arrows shows the formed structure dotted-the expected movements.
Note: The wave algorithm does not take into account the duration of the tool movements in time!


