


To open long positions on EURUSD, you need:
However, the expected reduction in interest rates by the European Central Bank did not happen, as a result, buyers took advantage of this moment and tried to return to the market, but they did not do it very well. At the moment, the bulls also missed the support of 1.1231 on the news that the European regulator is expanding the bond purchase program and the main task for the second half of the day will be to form a false breakdown in the support area of 1.1173, from where I recommend opening long positions. You can buy the euro on the rebound immediately from the minimum of 1.1137. In the scenario of buyers returning to the level of 1.1231 in the afternoon, the demand for EUR/USD may return, which will lead to a repeated update of the highs of 1.1279 and 1.1327, where I recommend fixing the profits. However, given the negative investor sentiment and panic in the stock markets, it is unlikely that a larger upward trend can be expected.
To open short positions on EURUSD, you need:
Sellers act exactly according to the scenario. The breakthrough of the support of 1.1279, which I paid attention to in my morning forecast, led to a larger decline in EUR/USD and a consolidation under the minimum of 1.1231, for which a real struggle may occur in the afternoon. The formation of a false breakdown in this range will be a direct signal to open short positions in the euro, which will lead to a further decline in the pair to the lows of 1.1173 and 1.137, where I recommend fixing the profits. In the scenario of EUR/USD growth above the resistance of 1.1231, it is best to return to short positions only after testing the maximum of 1.1327 or to rebound from the larger resistance of 1.1379.
Signals of indicators:
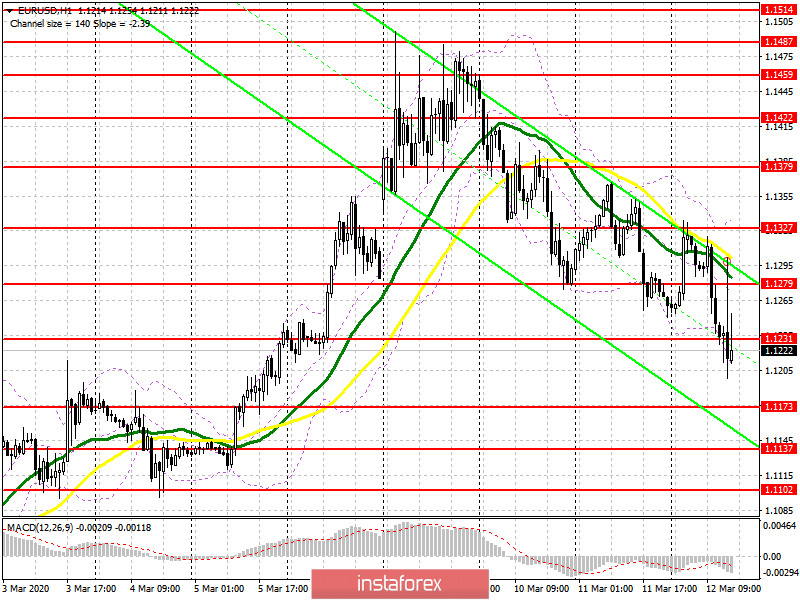
Moving averages
Trading is conducted below 30 and 50 moving averages, which limit the upward potential and keep the market bearish.
Bollinger Bands
A break in the lower border of the indicator around 1.1231 will lead to a further decline in the euro, while growth will be limited in the upper level of 1.1327.
Description of indicators
- Moving average (moving average determines the current trend by smoothing out volatility and noise). Period 50. The graph is marked in yellow.
- Moving average (moving average determines the current trend by smoothing out volatility and noise). Period 30. The graph is marked in green.
- MACD indicator (Moving Average Convergence / Divergence - moving average convergence / divergence) Fast EMA period 12. Slow EMA period 26. SMA period 9
- Bollinger Bands (Bollinger Bands). Period 20


