


To open long positions on GBPUSD, you need:
The package of measures aimed at fighting the coronavirus and helping the UK economy clearly did not appeal to buyers of the British pound, since it is likely that interest rates will remain at current levels, or even lower, for a fairly long period of time. The bulls showed only a little activity from the low of 1.2664, which I paid attention to in my morning forecast, but then the pressure on the pound returned. The breakthrough of the February lows opened a new downward potential in GBP/USD, and where the fall of GBP/USD will be stopped now is anyone's guess. I do not recommend going back to long positions on the pound today, as the bearish trend is very strong. The nearest support levels are located around 1.2600 and 1.2522.
To open short positions on GBPUSD, you need:
Sellers achieved a breakthrough of the support of 1.2798, and then, as expected, easily failed the February minimum, reaching support of 1.2707, and then to 1.2664. Fixing below this level has kept the market bearish and now all the fight will be waged for a minimum of 1.2600. A break in this range can easily bring down the GBP/USD to the support area of 1.2522 and 1.2417, where I recommend fixing the profits. However, you will be very careful with sales for breaking the lows, as the pair has already lost more than 2% since the opening. It is best to open short positions after an upward correction from the highs of 1.2664 and 1.2707, but again, subject to the formation of a false breakdown there. Sales immediately on the rebound are relevant in the area of 1.2744 and 1.2798.
Signals of indicators:
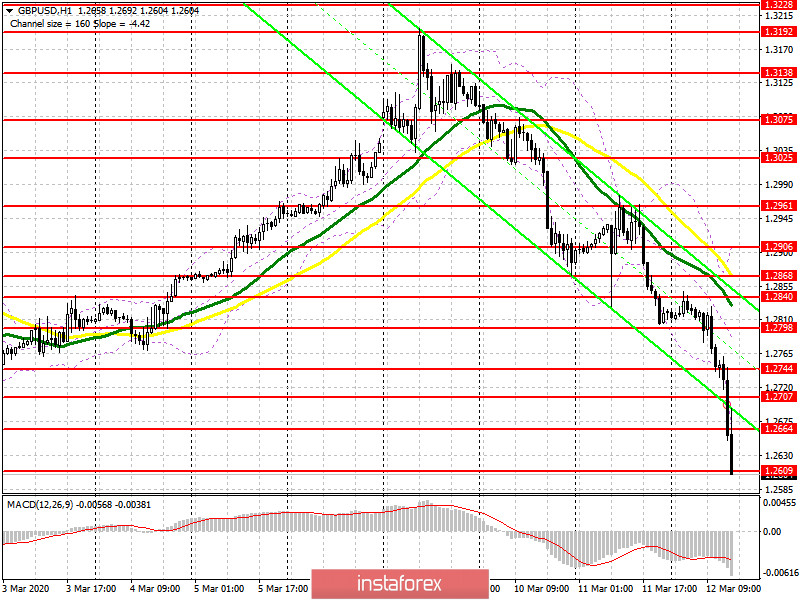
Moving averages
Trading is below the 30 and 50 daily averages, which indicates that the bearish trend is continuing.
Bollinger Bands
In the case of an upward correction, the average border of the indicator around 1.2798 will act as a resistance.
Description of indicators
- Moving average (moving average determines the current trend by smoothing out volatility and noise). Period 50. The graph is marked in yellow.
- Moving average (moving average determines the current trend by smoothing out volatility and noise). Period 30. The graph is marked in green.
- MACD indicator (Moving Average Convergence / Divergence - moving average convergence / divergence) Fast EMA period 12. Slow EMA period 26. SMA period 9
- Bollinger Bands (Bollinger Bands). Period 20


