EUR/USD
Analysis:
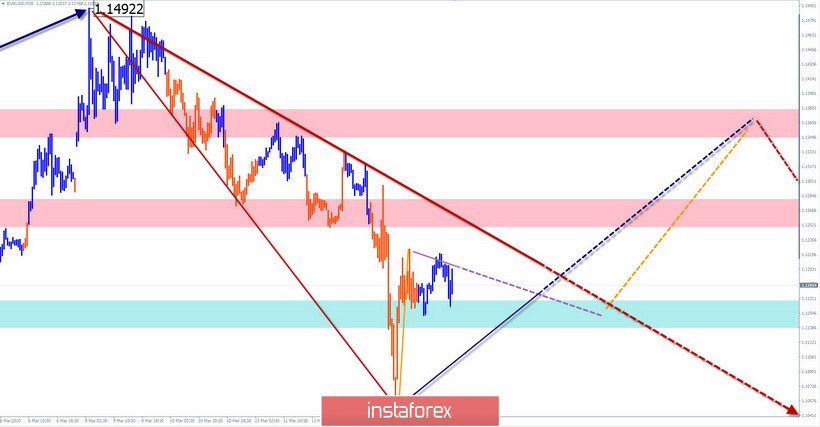
By the coincidence of several signs on the chart of the European currency, we can conclude that the last upward wave has ended. The price decline that started on March 9 has a high wave level. It is highly likely to be the start of a new short-term trend wave. The wave reached the support level.
Forecast:
Before the further decline, a correction wave of the previous decline section should be formed. In the upcoming trading sessions, an upward movement of the pair is expected. In the case of a breakthrough in the nearest resistance zone, it is possible to expect further growth today.
Potential reversal zones
Resistance:
- 1.1350/1.1380
- 1.1250/1.1280
Support:
- 1.1170/1.1140
Recommendations:
As part of the intraday trading style, short-term purchases of euros are possible today. It is more reasonable to reduce the lot. The best tactic is to refrain from trading during the price rise and at the end of it, track the sell signals.

AUD/USD
Analysis:
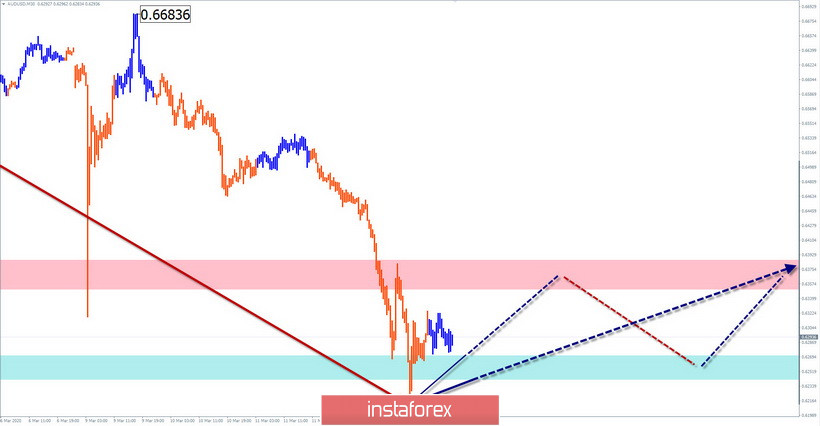
The daily chart of the Australian currency for more than 2 years shows a bearish trend. Since the beginning of this year, the pair's price has been declining, continuing the global trend. The price is located at the upper border of the intermediate support zone.
Forecast:
At current levels, there is a high probability of forming an upward pullback. Today, the rise may be small. Probably, it will take the form of a "sideways" in the first half of the day, there may be pressure on the support zone. A further upswing of the price move may exceed the level of the pullback of the last section of the trend.
Potential reversal zones
Resistance:
- 0.6350/0.6380
Support:
- 0.6270/0.6240
Recommendations:
Conditions for the sales of the pair has not yet been created on the market. It is recommended to refrain from entering the market until the end of the entire current wave up. Intraday style purchases are possible today but can be risky.

Explanation: In the simplified wave analysis (UVA), waves consist of 3 parts (A-B-C). The last incomplete wave is analyzed. The solid background of the arrows shows the formed structure and the dotted one shows the expected movements.
Note: The wave algorithm does not take into account the duration of the tool movements in time!


