


Economic calendar (Universal time)
Today, there are no important indicators in the economic calendar.
EUR / USD
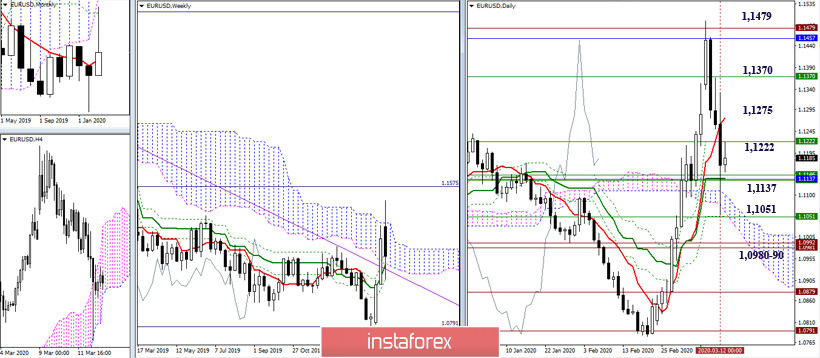
Yesterday, the pair performed a fairly effective decline, but failed to gain a foothold below the important line of 1.1137 (monthly Tenkan + weekly levels + daily Kijun). Today, we close the week, the brighter and larger the "Candlestick Lines" candlestick pattern will be formed in the weeks, the greater the prospects for the players to decline to have in the future. The formation of the Wave or an ordinary candle with long shadows is most likely to be followed by uncertainty and instability of market sentiment. The nearest resistances at upper time intervals can be noted today at 1.1222 (weekly Fibo Kijun) - 1.1275 (daily Tenkan) - 1.1370 (upper border of the weekly cloud). In this situation, support are 1.1137 - 1.1051 (daily cloud + Fibo Kijun + weekly Fibo Kijun) - 1.0981-92 (historical levels).
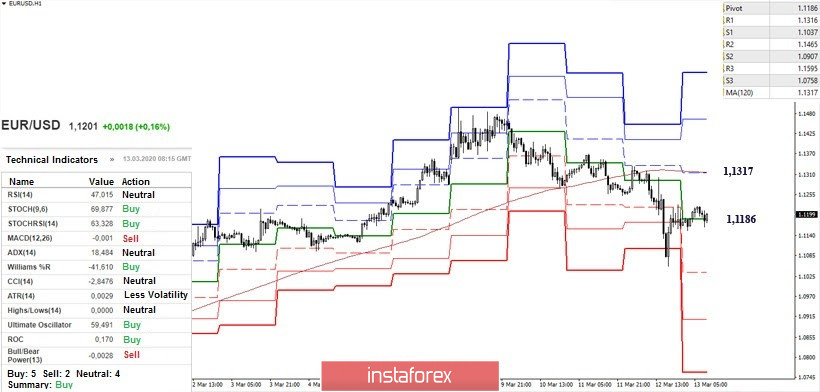
At H1, the euro is now in the correction zone, while the players to increase are trying to take control of the central Pivot level of the day (1.1186). Maintaining positions will allow us to develop a correctional upward turn, the main guideline of which is the resistance to the weekly long-term trend (1.1317). At the same time, consolidating above the movable and its reversal will change the current balance of forces, as a result of which the next important reference will be the update of the maximum of 1.1496. In case of exit from the correction zone and continued decline in support, they are located at 1.1037 - 1.0907 - 1.0758 today.
GBP / USD
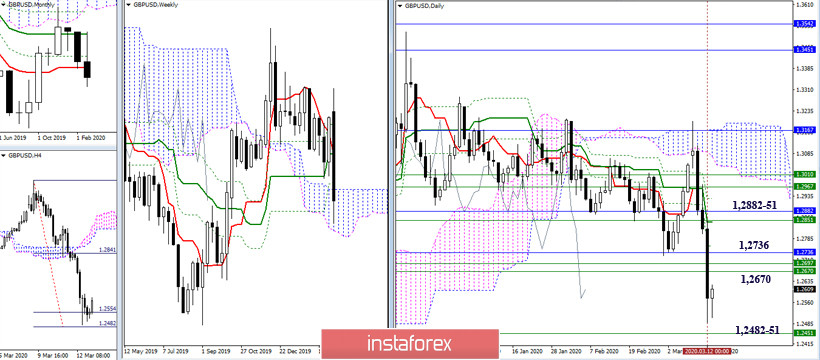
Yesterday was another productive day. Today, we are closing the week. The result may be a bearish Absorption in the weeks, which may contribute to the return of players to decline in the bearish zone relative to the weekly cloud. The nearest resistance is now located at 1.2670 - 1.2736 - 1.2851-82. In this situation, support is a bearish target for the breakdown of the H4 cloud (1.2554 - 1.2482) and the lower boundary of the weekly cloud 1.2451.
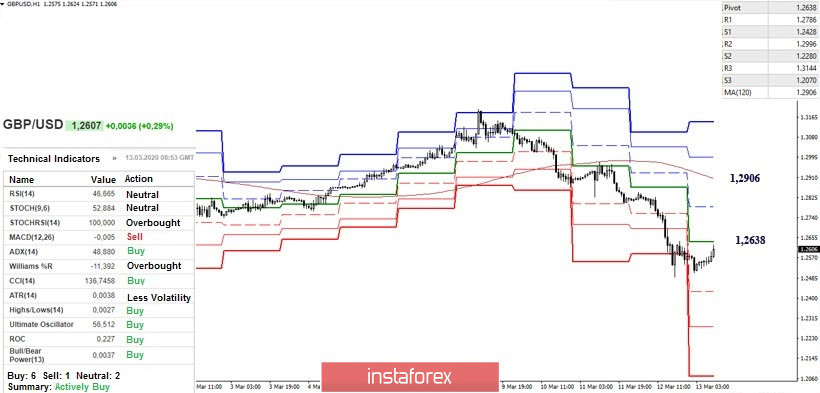
Also yesterday, the downward trend of the lower halves was well developed. Today, if it continues, the reference points within the day will be the support of the classic Pivot levels located at 1.2428 - 1.2280 - 1.2070. Currently, the pair is in the correction zone. With the development of an upward correction, the most important resistance will come into operation at the boundaries of the central Pivot level (1.2638) and the weekly long-term trend (1.2906), as an intermediate resistance, the level R1 (1.2786) can be noted.
Ichimoku Kinko Hyo (9.26.52), Pivot Points (classic), Moving Average (120)


