


4-hour timeframe
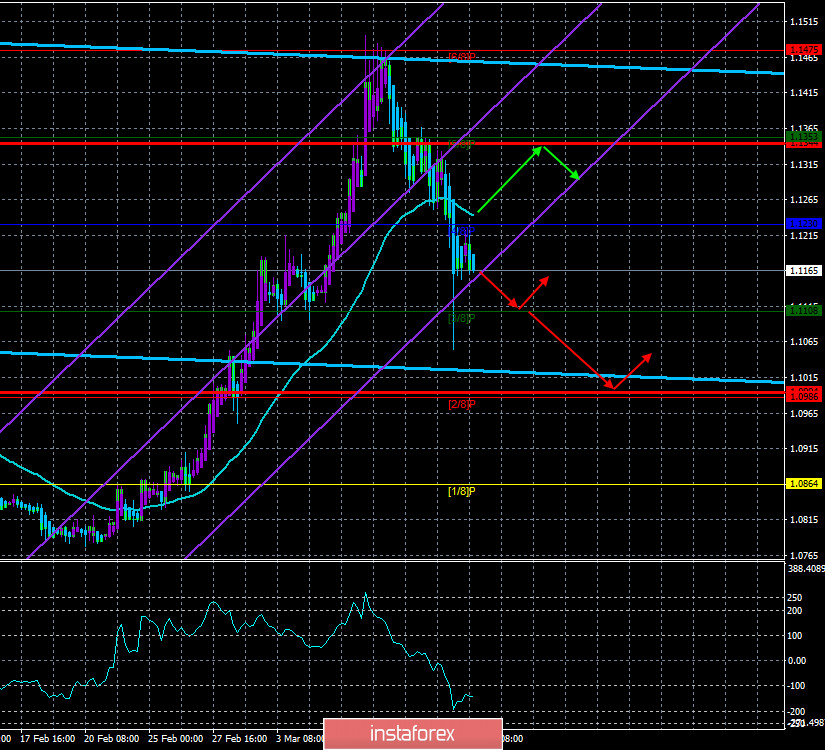
Technical details:
Higher linear regression channel: direction - downward.
Lower linear regression channel: direction - upward.
Moving average (20; smoothed) - downward.
CCI: -147.4815
Yesterday was an absolutely record day for the EUR/USD currency pair in terms of volatility. During the day, the pair "passed" 279 points. It's hard to even remember the last time the pair traded so actively. Recall that the normal value of volatility for the euro/dollar pair is 40-60 points per day. However, what can you do if the markets are in a frankly panicked state for the second week in a row? At the same time, if you start listing all the factors that affect the behavior of traders now, then not even a page will be enough. It all started, of course, with the "coronavirus". However, the most interesting thing is that the epidemic began in China in December 2019 and reached other countries and continents of the world only in February. Before governments sounded the alarm, started declaring quarantines, closing borders, and restricting communication with the most infected countries, there were no special signs of slowing down the economy, either in the world, Europe, or the United States. Moreover, judging solely by macroeconomic statistics, there are no changes in the world at all. Data from overseas is still strong, and data from Europe is still noticeably weak. Before the start of the panic, the euro currency fell against the US dollar for three weeks in a row without fail. Then, of course, the correction began. Weak at first. And somewhere in three days of this correction, general chaos began. The US stock market began to fall down every day. Investors, major players, financial institutions, international companies are panicking, starting to "drive" huge capital from one asset to another. And this is absolutely normal for a state of panic.

It should be understood that when there is no panic, transactions on the international currency market are carried out, as they are called, in a calm mode. Sudden movements are rare. But when panic begins, many market participants start making transactions that they would not have made if not for this very panic. In other words, panic breeds more panic. Plus volumes. Market participants strive to minimize their losses, transfer their money to the safest assets and get rid of the riskiest ones. However, the concept of "security" is different for everyone. For a long time, the Swiss franc and Japanese yen were considered safe-haven currencies, but have these currencies strengthened much in the past month? There is an opinion that the best currency is the currency of a stable and most economically strong country – that is, the US dollar. However, over the past month, the dollar has managed to fall in price and become more expensive. Gold? Bitcoin? Government securities? By and large, it doesn't matter. The meaning of any panic is that the markets begin to "storm". There is no single most secure asset. Companies that need to carry out their activities cannot stop doing so and, in order to avoid losses, transfer all their assets to government securities. If you need euros for operating activities, then the company will buy euros, even if it is growing in price and now is not a good time. If the company wants to ensure against future risks associated with changes in the exchange rate, it will carry out hedge operations. Speculators and traders who aim to make a profit at the expense of exchange rate differences will try to transfer assets, for example, to gold, since not everyone can buy securities. And how many bitcoins were sold in the wake of the general panic? The bitcoin exchange rate has sunk to $4000.
The meaning of all this is the same: panic, it is impossible to predict. It is impossible to conclude now that a particular currency will grow. The stock market collapsed for several days – the US dollar fell against the euro and the pound. Now the market continues to collapse – but it is the US currency that is getting more expensive. Despite the fact that after the Fed eased monetary policy immediately by 0.5% and is going to bring the key rate almost to zero in the near future. And why does the US dollar continue to grow, if the ECB did not even lower the rate, but only decided to pour an additional 120 billion euros into the market? Because there is no correlation between what is happening now in the currency market and what is happening, for example, in the stock market. There is no correlation between the euro/dollar exchange rate and the actions of the Fed and the ECB. It is based on this judgment that we offer traders to trade.
The last thing I would like to pay attention to is why the European currency collapsed yesterday. The ECB did not make any "shocking decisions". Moreover, it disappointed the markets more with the weakness of the measures taken. But the euro currency still fell in price, started to fall in price during the night, and during the day fell by almost 300 points and continues to move steadily down today.
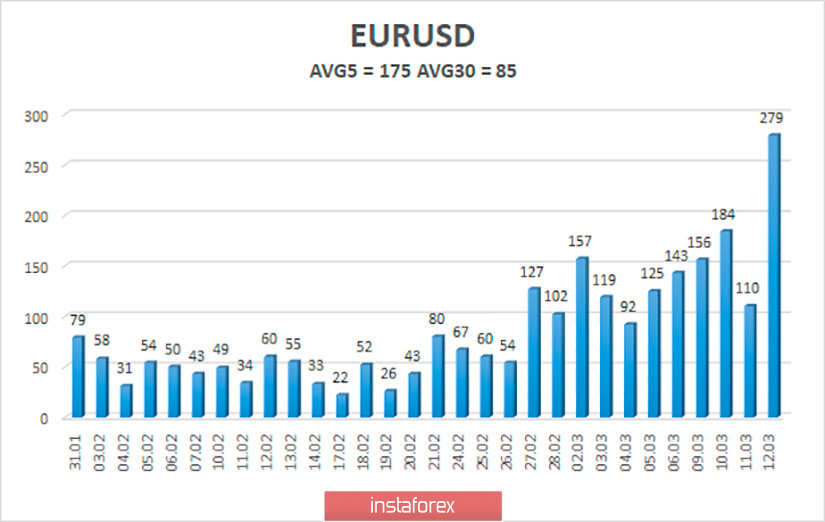
The average volatility of the euro/dollar currency pair remains at record values and continues to increase. At the moment, the average volatility for 5 days is already 175 points. This value once again confirms the fact that the markets remain in a very excited state and can move in any direction with a new force at almost any moment. Thus, on Friday, we again expect a decrease in volatility and movement within the channel, limited to the levels of 1.0994 and 1.1344.
Nearest support levels:
S1 - 1.1108
S2 - 1.0986
S3 - 1.0864
Nearest resistance levels:
R1 - 1.1230
R2 - 1.1353
R3 - 1.1475
Trading recommendations:
The euro/dollar pair can be said to have resumed its downward movement. Thus, it is now recommended to consider the sale of the euro currency with the targets of 1.1108 and 1.0994, before the reversal of the Heiken Ashi indicator to the top. It will be possible to return to buying the pair after the price is re-anchored above the moving average line with the first target of 1.1344.
Explanation of the illustrations:
The highest linear regression channel is the blue unidirectional lines.
The lowest linear regression channel is the purple unidirectional lines.
CCI - blue line in the indicator window.
Moving average (20; smoothed) - blue line on the price chart.
Murray levels - multi-colored horizontal stripes.
Heiken Ashi is an indicator that colors bars in blue or purple.
Possible variants of the price movement:
Red and green arrows.


