


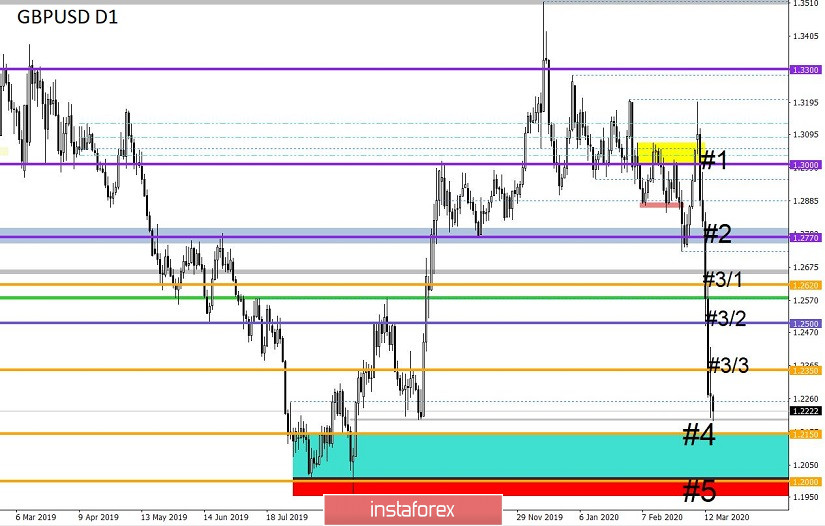
From a comprehensive analysis, we see a massive downward move, where the quote has already moved closer to the conditional area of interaction of trading forces. Now about the details. 895 points – this is how much we managed to pass in five trading days, which led the quote to the values of October last year. Let me remind you that the main stumbling block was the range of 1.2770//1.2885//1.3000 where the quote hung for a long time, but as soon as the lower border fell, the picture changed radically. The levels were located under the price and speculative interest in the flow of the external background had a predominant growth, which led to the breakdown of three stages of recovery at once #3/1 (1.2620); #3/2 (1.2500); #3/3 (1.2350).
Considering the theory of downward development, we see that the recovery process relative to the medium-term upward trend has reached the level of 84%, which means that the downward trend will soon update the lows. In turn, the area of interaction of trading forces, which shows us two stages of recovery #4 (1.2150) and #5 (1.2000), is in close proximity, which means that pressure may appear locally, which will lead to a partial closure of medium-term operations. In terms of long-term consideration, the prospect of a transition to new historical lows is possible, and the unquenchable external background will help us in this.
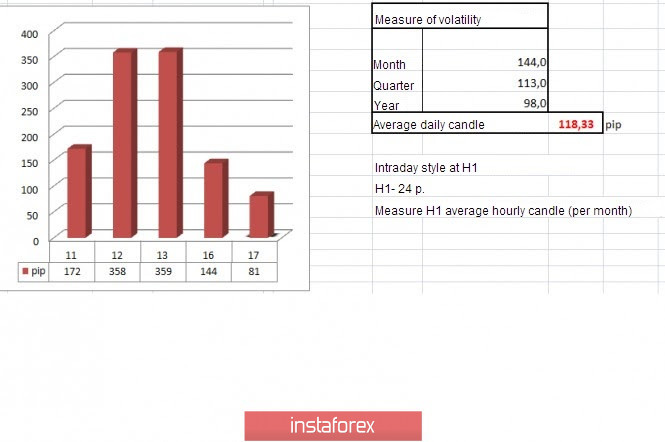
In terms of volatility, we see a decrease in activity relative to the previous days, but if we take into account the average daily indicator, the acceleration is still maintained in the market. It is worth noting that there are no prerequisites for a strong decrease in volatility yet, thus speculators will continue to work on local operations.
Volatility details: Monday-110 points; Tuesday-102 points; Wednesday-102 points; Thursday-107 points; Friday-103 points; Monday-165 points; Tuesday-245 points; Wednesday-172 points; Thursday-358 points; Friday-359 points; Monday-144 points. The average daily indicator relative to the volatility dynamics is 118 points (see the volatility table at the end of the article).
Detailing the past day by the minute, we see that the quote from the beginning of the European session and up to 19:30 (trading terminal time) had a downward interest, where the coordinates of 1.2200 were reached, which coincides with the deceleration point from November 8-10 last year. The subsequent development was in the conditional range of 1.2200/1.2272.
As discussed in the previous review, traders continue to work on the downside, where the target is located in the area of interaction of trading forces 1.2000/1.2150.
Looking at the trading chart in general terms (daily period), we see that the quote has already passed a considerable distance relative to the value of the medium-term trend, where there are about 250 points left to new lows, which is a small distance for this activity.
The news background of the past day did not have anything serious in terms of statistics for the UK and the United States.
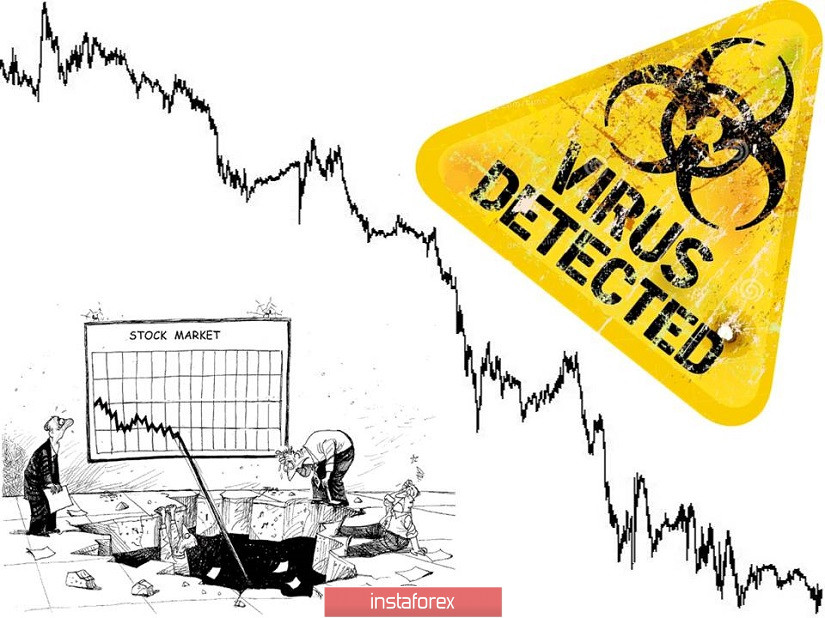
In terms of the general information background, we had news about the actions of the Federal Reserve System, which once again reduced the refinancing rate to 0.25%. Investors are perplexed, and the fear of the coronavirus and the consequences are pulling global markets to the bottom.
In turn, the new head of the Bank of England, Andrew Bailey, reminded the market that they recently lowered the interest rate and are ready to continue to act promptly as necessary, so that the negative economic consequences of the coronavirus do not increase.
"That is why you saw our actions last week, and that is why you will see operational measures again when we need to take them. You can be sure of that," said Andrew Bailey.
That is, the risk of further reduction of the refinancing rate below the level of 0.1% is possible, which will negatively affect the pound.
Today, in terms of the economic calendar, we have data on the unemployment rate in Britain, where they forecast a decline from 3.8% to 3.7%. At the same time, there will be indicators on the number of applications for unemployment benefits, which should grow from 5,500 to 24,000. In the afternoon, I will publish indicators on retail sales in the United States, where they are waiting for a slowdown from 4.4% to 2.7%.
Further development
Analyzing the current trading chart, we see that the fluctuation within the specified range of 1.2200/1.2272 is still maintained in the market, although an attempt to break the lower border was recorded. In fact, sellers who are already on the tap at a low level continue to hold short positions, which does not allow the quote to go into a technical correction. The area of interaction of trade forces between stages #4 (1.2150) and #5 (1.2000) is particularly important since the historical minimum of 1.1957 (September 3, 2019) moved from a massive downward movement to a stop point and as a fact of reversal. At the same time, we should not forget the theory that the subsequent testing of the level at the downward development will already have less pressure than at the initial touch. We used this theory when developing quotes in the range of 1.2770//1.2885/1.3000, where the boundaries at successive touches reduced the pressure.
From the point of view of emotional mood, we see that the external background does not allow us to reduce activity in the market, where the coefficient of speculative operations remains at a high level.
Detailing the minute-by-minute time period, we see that the quote has variable frames that were set by the price during the Pacific session. With the release of the Europeans, the quote resumed its downward course, updating the minimum (1.2191), but at the same time, the concentration on the range of 1.2200/1.2272 remains.
In turn, traders continue to work on the downside, where they are already considering fixing previously formed profits. It is worth understanding that medium-term traders have been working for sale for several months, where a sufficient profit was formed, and the interaction area of 1.2000/1.2150 can play an excellent role in regrouping trading forces.
Having a general picture of actions, we can assume that the existing stagnation of 1.2200/1.2272 will not last long, and if the main course is held, the movement towards 1.2000-1.2150 will continue. It is worth noting that if you consider yourself a speculator, then I would look at the existing oscillation inside 1.2200/1.2272, working on the local momentum when the boundaries are broken. That is, entering the market on impulse.
Based on the above information, we will output trading recommendations:
- Buy positions are considered if the price is fixed higher than 1.2280, with the prospect of a move to 1.2350.
- Sell positions are already moving towards 1.2150-1.2000. If we do not have positions, then the input is made at the full output from the range.
Indicator analysis
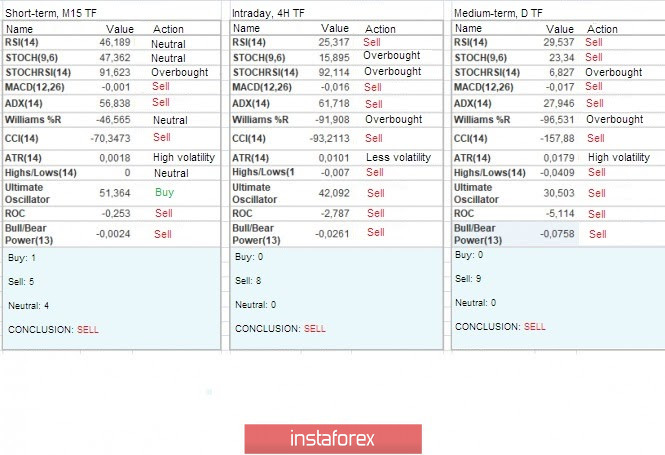
Analyzing different sectors of timeframes (TF), we see that the indicators of technical instruments unanimously occupy a downward position due to the general background of the market.
The volatility for the week / Measurement of volatility: Month; Quarter; Year.
The volatility measurement reflects the average daily fluctuation, calculated for the Month / Quarter / Year.
(March 17 was based on the time of publication of the article)
The current time volatility is 81 points, which is still a low value relative to the entire possible dynamic. It is likely to assume that the external background and speculative activity will continue to put pressure on volatility, having indicators above average.
Key levels
Resistance zones: 1.2350**; 1.2500; 1.2620; 1.2725*; 1.2770**; 1.2885*; 1.3000; 1.3170**; 1.3300**; 1.3600; 1.3850; 1.4000***; 1.4350**.
Support zones: 1.2150**; 1.2000***; 1.1700; 1.1475**.
* Periodic level
** Range level
*** Psychological level
****The article is based on the principle of conducting a transaction, with daily adjustments.


