


On Friday, after retesting the support line 1.0652 (white bold line) the pair quickly went up, but the strong calendar news quickly ended the bullish scenario (the price played 136 points down). Today, a continuation of the upward pullback movement is possible. Strong calendar news is not expected today.
Trend analysis (Fig. 1).
Today, from the level of 1.0696 (closing of the Friday afternoon candle) the price will try to continue to move up with the target of 1.0841, a retracement level of 23.6% (red dashed line). If this level is reached, the continuation of the upward movement is with the next target of 1.0967, a retracement level of 38.2.% (Red dashed line).
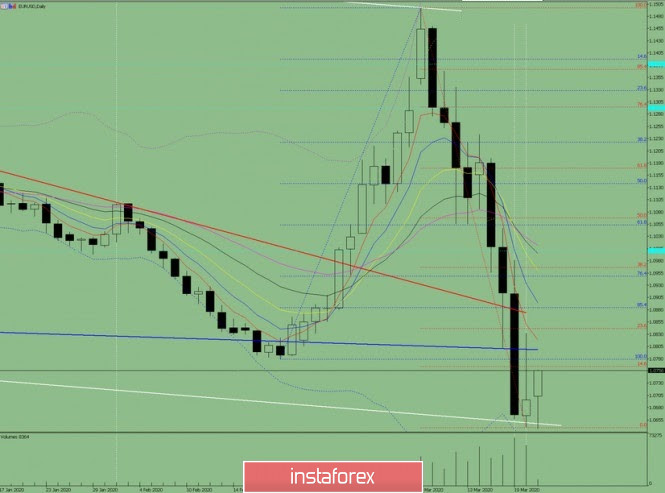
Fig. 1 (daily chart).
Comprehensive analysis:
- Indicator analysis - up;
- Fibonacci levels - up;
- Volumes - up;
- Candlestick analysis - up;
- Trend analysis - up;
- Bollinger Lines - up;
- Weekly schedule - up.
General conclusion:
Today, from the level of 1.0696 (closing of the Friday afternoon candle) the price will try to continue to move up with the target of 1.0841, a retracement level of 23.6% (red dashed line). If this level is reached, the continuation of the upward movement is with the next target of 1.0967, a retracement level of 38.2% (Red dashed line).
Unlikely scenario: from the level of 1.0696 (closing of the Friday afternoon candle), work down with the target of 1.0335, a retracement level of 161.8% (blue dotted line).


