


The pair continued to move down on Friday, testing the support line 1.1413 (black bold line) and after that the price went up. Strong calendar news on the dollar came out at 12:00 UTC and the market worked the news down. Today, a continuation of the upward movement is possible. Strong calendar news is not expected.
Trend analysis (Fig. 1).
Today, from the level of 1.1642 (closing of the Friday afternoon candle), an upward pullback is possible with testing the retracement level of 23.6% equivalent to 1.1834 (red dashed line). Upon reaching this line, the continuation of the upward movement is possible with the target of 1.2096, a retracement level of 38.2% (red dashed line).
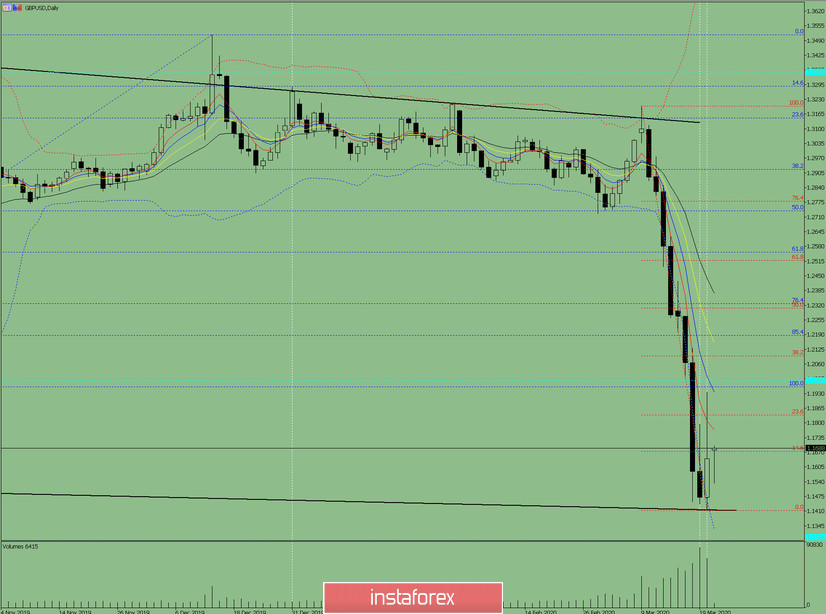
Fig. 1 (daily chart).
Comprehensive analysis:
- Indicator analysis - up;
- Fibonacci levels - up;
- Volumes - up;
- Candlestick analysis - up;
- Trend analysis - up;
- Bollinger Lines - up;
- Weekly schedule - up.
General conclusion:
Today an upward pullback is possible.
An unlikely scenario: from a pullback level of 14.6% - 1.1676 (red dashed line), work down with the target at the historical support level 1.1294 (blue dashed line).


