


GBP/USD
Analysis:
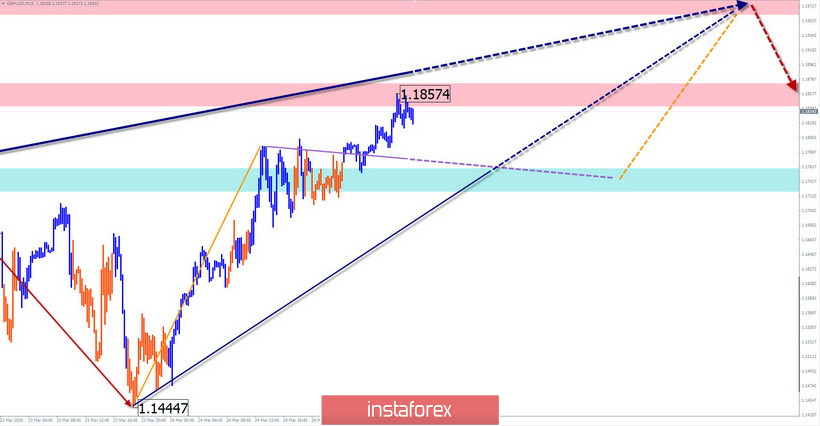
The downward trend continues to dominate the chart of the British currency. Its last section started on March 9. Since March 18, correction develops from strong support. Previously, the price may rise by another 2 price figures from the current exchange rate.
Forecast:
Today, the pair's market is expected to see a general upward trend in the price movement. A short-term decline is possible in the next trading session. A breakout of the nearest resistance zone is likely at the end of the day or tomorrow.
Potential reversal zones
Resistance:
- 1.1960/1.1990
- 1.1840/1.1870
Support:
- 1.1760/1.1730
Recommendations:
Today, trading the British pound is only possible within the intraday style. Purchases are a priority, but it is better to reduce the lot in them. In the area of the far resistance zone, it is recommended to track reversal signals.
USD/JPY
Analysis:
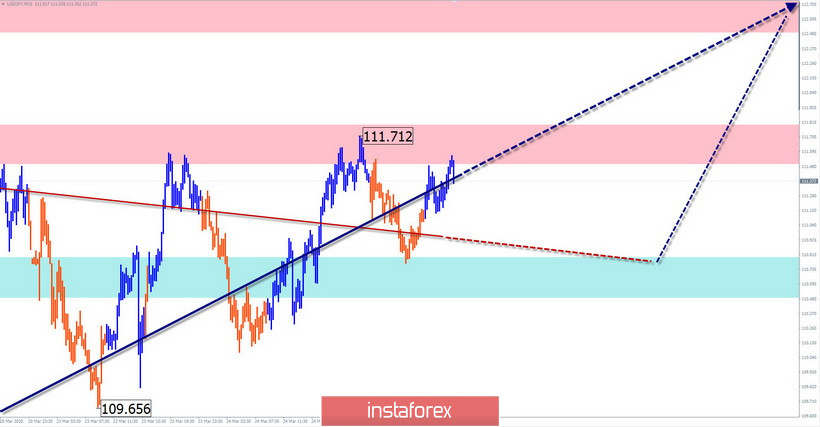
The upward wave of the Japanese yen, which started on March 9, gave rise to a new inter-day trend. In a larger wave of the daily scale, this is how the final part (C) began. The interim collection of recent days is nearing completion.
Forecast:
The current wave has a pronounced impulse character, so counter corrections are minimal. The nearest resistance zone is expected to break through in the next day. A short-term pullback is not excluded in the European session.
Potential reversal zones
Resistance:
- 112.50/112.80
- 111.50/111.80
Support:
- 110.80/110.50
Recommendations:
In the coming days, sales of the Japanese yen will not be relevant. It is recommended to focus on searching for signals to buy the instrument.
Explanation: In the simplified wave analysis (UVA), waves consist of 3 parts (A-B-C). The last incomplete wave is analyzed. The solid background of arrows shows the formed structure and the expected movements - dotted.
Note: The wave algorithm does not take into account the duration of the tool movements in time!


