


EUR/USD
Analysis:
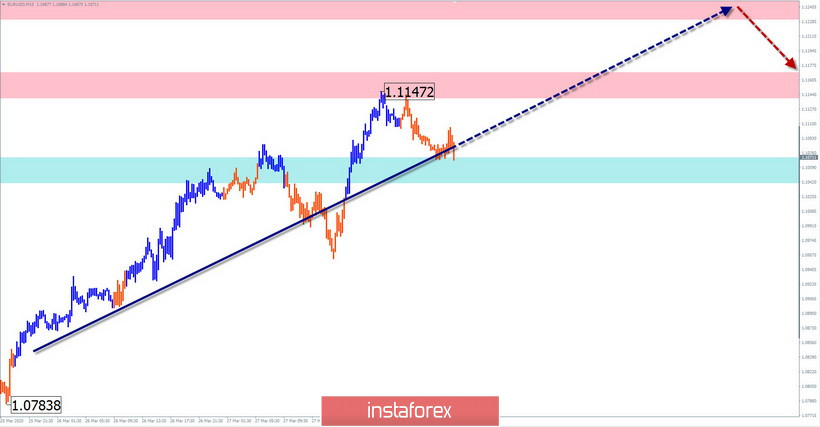
As part of the downward wave from May 9, a counter correction is formed for the last two weeks. The bullish wave brought the price to the area of the preliminary target zone. By now, the wave structure looks complete, but there are no formed reversal signals on the chart.
Forecast:
Today, the pair's market is expected to continue the general upward movement. If the nearest resistance zone is broken, the wave will probably extend up to the next calculated zone. In the morning, you can expect a sideways mood.
Potential reversal zones
Resistance:
- 1.1230/1.1260
- 1.1140/1.1170
Support:
- 1.1070/1.1040
Recommendations:
There are no conditions for selling the euro today. We recommend buying a pair with a reduced lot. The lift potential is limited by the upper design resistance.
AUD/USD
Analysis:
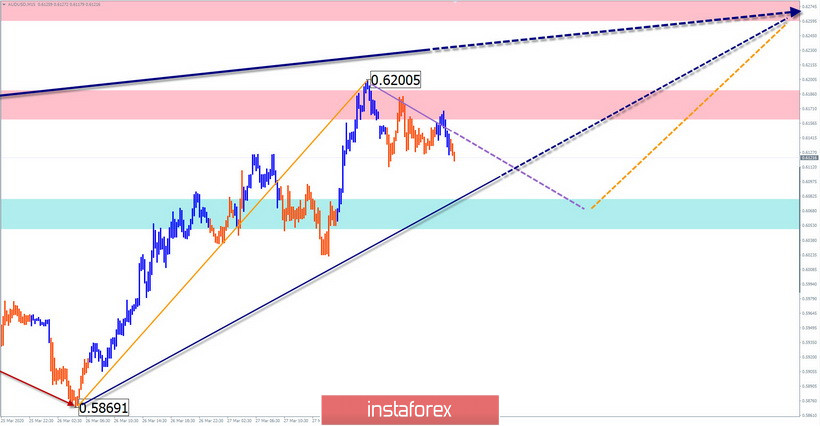
The upward wave section from March 19 took the place of the correction of the previous bearish section from January 1. The preliminary completion zone for the entire current wave is located around 65 of the price figure. The character of the wave is close to the pulse type. Oncoming traffic has the form of a sideways flat.
Forecast:
During the current day, it is most likely to move in the lateral plane between the nearest oncoming zones. By the end of the day, the bullish mood is expected to resume. It is possible to break the nearest resistance and rise to the next zone.
Potential reversal zones
Resistance:
- 0.6260/0.6290
- 0.6160/0.6190
Support:
- 0.6080/0.6050
Recommendations:
Today, selling a pair can be quite risky. It is recommended that the main attention be paid to the search for buy signals in the area of the calculated resistance.
GBP/JPY
Analysis:
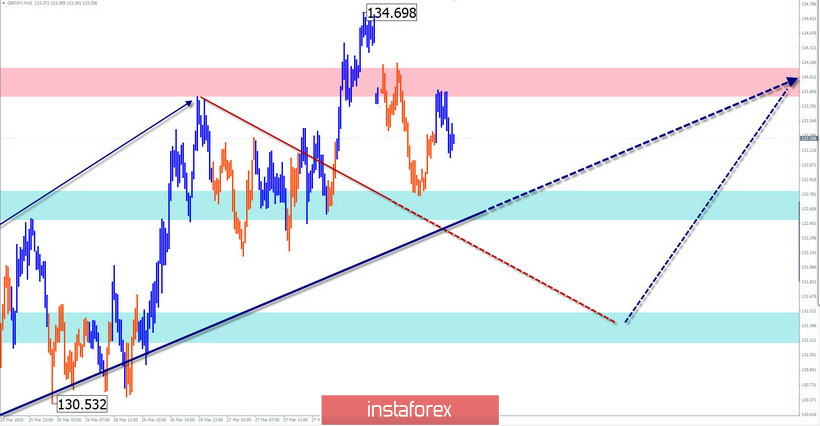
The upward wave from March 18 forms a full correction of the previous bearish wave on the pound chart. It develops on an impulse type with counter-movements of the wrong kind. In the last two days, the price moves along the lower border of the large-scale resistance zone.
Forecast:
In the structure of the wave, there is a need for a corrective decline. In the upcoming sessions, a flat mood is likely between the nearest counter zones. If the lower limit of the nearest support is broken, the price is expected to fall to the next zone. You can expect a return to the upward rate at the end of the day or tomorrow.
Potential reversal zones
Resistance:
- 133.80/134.10
Support:
- 132.80/132.50
- 131.50/131.20
Recommendations:
Supporters of long-term deals should refrain from entering the pair's market during the pullback. Intraday traders today can make short-term sales with a reduced lot. Buy signals need to be tracked in the areas of the control support zones.
Explanation: In the simplified wave analysis (UVA), waves consist of 3 parts (A-B-C). The last incomplete wave is analyzed. The solid background of the arrows shows the formed structure and the dotted one shows the expected movements.
Note: The wave algorithm does not take into account the duration of the tool movements in time!


