


To open long positions on EUR/USD:
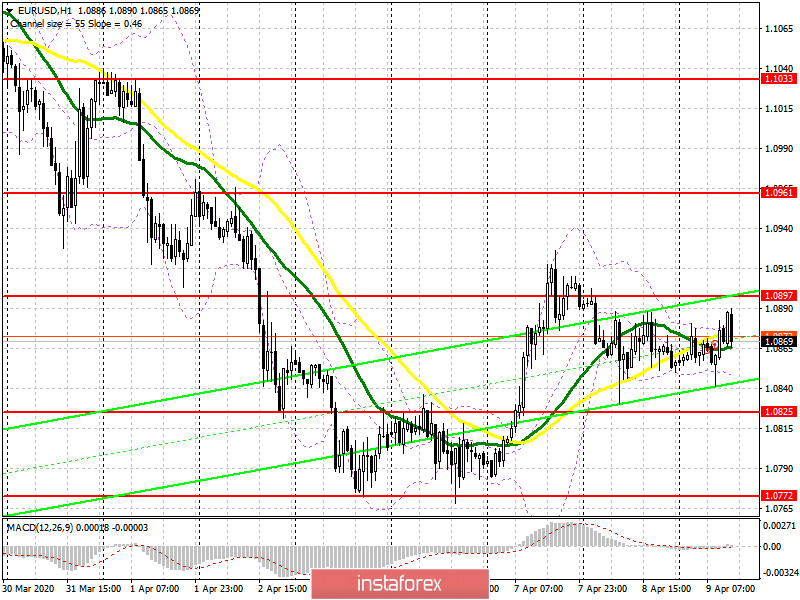
The Eurogroup meeting is still ongoing. Based on the results of the meeting, the euro can either extend the rally or fall to new yearly lows. Germany's foreign trade balance data for February has not caused any reaction in the market, since the information was irrelevant amid the spread of the coronavirus. From a technical point of view, nothing has changed since the pair remained in the lateral channel. Bulls still need to return to the resistance level of 1.0897. In this case, the pair is likely to keep rising and reach the new high of 1.0961. It is preferable to take profit at this level. If the euro drops to the support level of 1.0825, it is better to reopen long positions only after the formation of a false breakdown at this level. It is better to buy the EUR/USD pair immediately on a rebound from the weekly low at 1.0772, taking into account a 40-50 pips intraday correction.
To open short positions on EURUSD:
The pair did not break through the resistance level of 1.0897. Apart from that, there were no signals such as a false breakdown to open sell deals. If the price breaks through the low of 1.0825, the EUR/USD pair is likely to return to the weekly low of 1.0772 where it is preferable to take profit. If the price decreases to the support level of 1.0636, it will indicate the renewal of the downtrend. In case of a positive outcome of the Eurogroup meeting, the EUR/USD is likely to rise above the resistance level of 1.0897 where it is better to refrain from selling the euro immediately on a rebound until the price reaches the new high of 1.0961, taking into account an intraday correction of 30-40 pips, or rises even higher, to 1.1033.
Signals of indicators:
Moving averages
Trading is carried out in the region of 30 and 50 daily moving averages, which indicates market uncertainty about a further direction.
Note: The period and prices of moving averages are reviewed by the author on the hourly chart H1 and differ from the general definition of the classic daily moving averages on the daily chart D1.
Bollinger Bands
Repeated testing of the lower border of the indicator in the area of 1.0845 may lead to a larger sell-off of the euro.
Description of indicators
- Moving average (moving average determines the current trend by smoothing out volatility and noise). Period 50. The line is marked in yellow.
- Moving average (moving average determines the current trend by smoothing out volatility and noise). Period 30. The line is marked in green.
- MACD indicator (Moving Average Convergence/Divergence) Fast EMA period 12. Slow EMA period 26. SMA period 9
- Bollinger Bands. Period 20


