


To open long positions on GBP/USD:
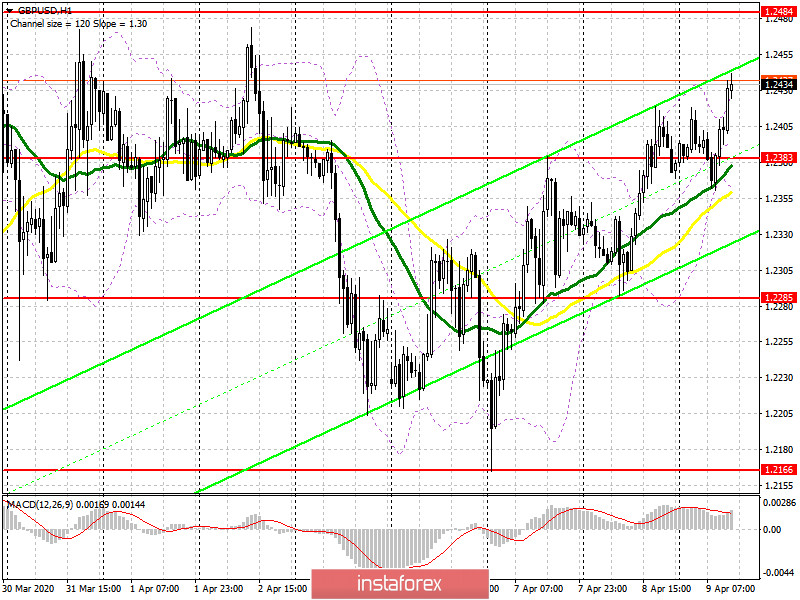
Buyers of the pound did not react on the news that the UK economy decreased by 0.1% in February this year compared to March. A false breakthrough was formed after the price returned to the level of 1.2383, which is clearly visible on the 5-minute chart, Then, the GBP/USD pair increased to the resistance level of 1.2484. At the moment, it is important for the bulls to break through and consolidate above the resistance level of 1.2484, which can lead to further growth of the pound to the highs of 1.2605 and 1.2686, where it is preferable to take profit. If the pair decreases, it is better to return to long positions only after the pair reaches the lower border of the channel at 1.2285. You can open buy deals immediately on a rebound from the weekly low of 1.2166, taking into account an intraday correction of 40-50 pips. It can be a wrong decision to wait for the pair to grow above the level of 1.2383.
To open short positions on GBP/USD:
Pound sellers failed to consolidate at 1.2383, and decided to wait until the price reached the higher resistance level, which is also the upper border of the side channel, 1.2484. A formation of a false breakthrough can be a signal to open short positions in order to return to the support level of .2383, which is the middle of the channel. The weak US labor market data is likely to remind traders of the current economic situation. As a result, the demand for safe-haven assets can increase. If the pair returns and consolidates below 1.2383, it can fall further and break through the support level of 1.2285. As a result, the GBP/USD pair can drop to a weekly low of 1.2166, where it is preferable to take profit. If the pound grows above the resistance level of 1.2484, it is better to return to short positions only when the price reaches the new highs of 1.2605 and 1.2686.
Signals of indicators:
Moving averages
Trading is carried out above the 30 and 50 daily moving averages, which indicates that the pound is likely to extend growth in a short-term.
Note: The period and prices of moving averages are reviewed by the author on the hourly chart H1 and differ from the general definition of the classic daily moving averages on the daily chart D1.
Bollinger Bands
The pound can fall sharply after the price breaks through the lower border of the indicator at 1.2380.
Description of indicators
- Moving average (moving average determines the current trend by smoothing out volatility and noise). Period 50. The line is marked in yellow.
- Moving average (moving average determines the current trend by smoothing out volatility and noise). Period 30. The line is marked in green.
- MACD indicator (Moving Average Convergence/Divergence) Fast EMA period 12. Slow EMA period 26. SMA period 9
- Bollinger Bands. Period 20


