


To open long positions on EURUSD, you need:
In the first half of the day, I paid attention to the level of 1.0969 and recommended opening short positions from it. From a technical point of view, nothing has changed given the fact that the bulls failed to break above this range. An important task for euro buyers remains to protect the support of 1.0897, where the formation of a false breakout will be a signal to open long positions in the expectation of continuing growth to the highs of 1.0969, with the breakdown of which problems have already arisen in the first half of the day. Only a consolidation above this level will open a direct path to the area of 1.1033, and then lead to an update of the maximum of 1.139, where I recommend fixing the profits. In the scenario of a larger decline today, the euro is below the level of 1.0897, which is unlikely, since many markets are closed today due to Easter Monday, long positions can be returned immediately to rebound from the minimum of 1.0834.
To open short positions on EURUSD, you need:
In the first half of the day, the bears showed themselves immediately after the resistance test of 1.0969, and returned the pair, first to the opening level of the day, and then tried to update the support at 1.0897, which they failed to do. The entire focus on this level will be shifted to the second half of the day, since it is required to close the day below this range to maintain the downward trend. Only this scenario will allow you to put on a larger update of the lows of 1.0834 and 1.0772 in the future, where I recommend fixing the profits. If the bears are less active in the second half of the day, then you can still return to short positions on a false break from the resistance of 1.0969 or sell immediately on a rebound from a larger maximum of 1.1033.
Signals of indicators:
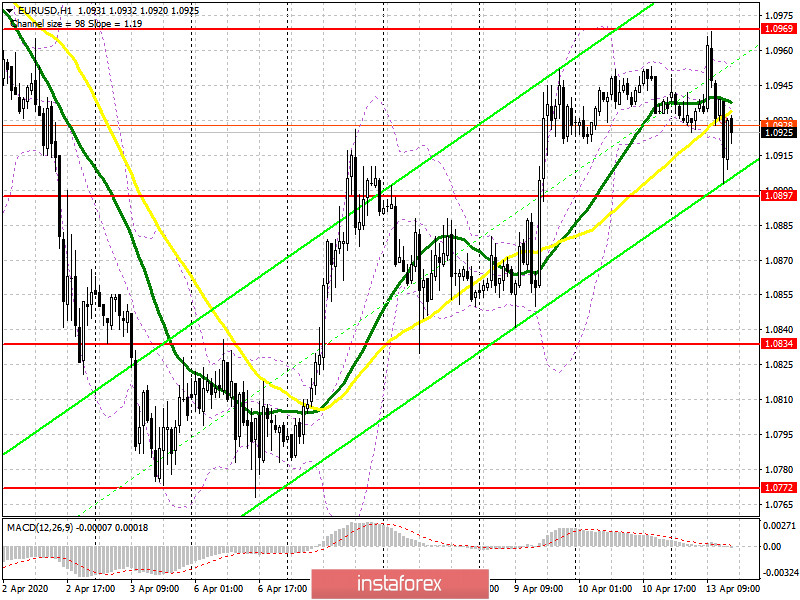
Moving averages
Trading is conducted in the area of 30 and 50 daily moving averages, which indicates market uncertainty with the future direction.
Note: The period and prices of moving averages are considered by the author on the hourly chart H1 and differ from the general definition of the classic daily moving averages on the daily chart D1.
Bollinger Bands
Breaking the upper limit of the indicator to the area of 1.0955 may lead to the new growth of the euro. While a break of the lower border in the area of 1.0920 will increase pressure on the euro.
Description of indicators
- Moving average (moving average determines the current trend by smoothing out volatility and noise). Period 50. The graph is marked in yellow.
- Moving average (moving average determines the current trend by smoothing out volatility and noise). Period 30. The graph is marked in green.
- MACD indicator (Moving Average Convergence / Divergence - moving average convergence / divergence) Fast EMA period 12. Slow EMA period 26. SMA period 9
- Bollinger Bands (Bollinger Bands). Period 20


