


To open long positions on EURUSD, you need:
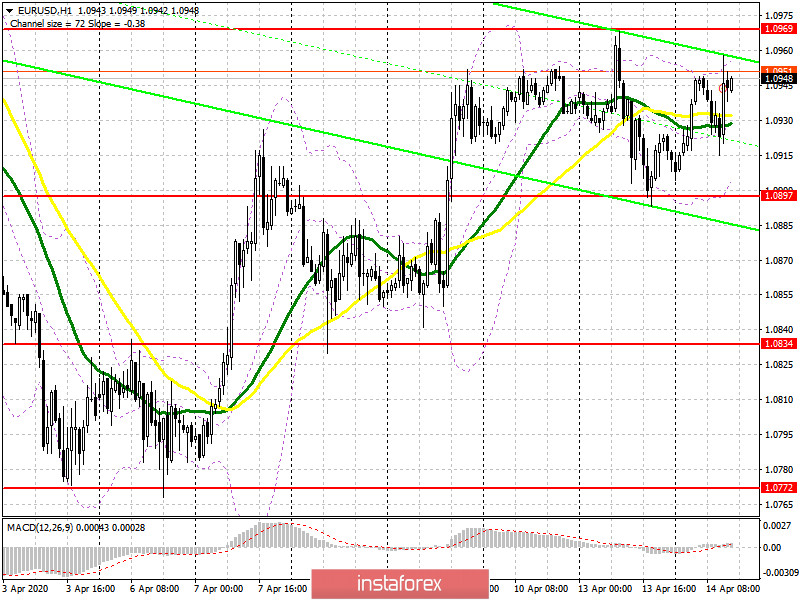
In the first half of the day, there were no changes in the market, and the price did not touch any of the target levels. The lack of fundamental statistics leaves the pair in a narrow side channel. An important task for euro buyers is to protect the support of 1.0897, where the formation of a false breakout will be a signal to open long positions in the expectation of continuing growth to the highs of 1.0969, with the breakdown of which there were problems yesterday. Only a consolidation above this level will open a direct path to the area of 1.1033, and then lead to an update to the maximum of 1.139, where I recommend fixing the profits. In the scenario of a larger decline today, the euro is below the level of 1.0897, which is unlikely, since the economic calendar is almost empty and in the afternoon, long positions can be returned immediately to rebound from the minimum of 1.0834.
To open short positions on EURUSD, you need:
Like yesterday, the primary task of sellers of the euro is to form a false breakout in the resistance area of 1.0969, which will be a signal to open short positions in the expectation of a decline to the support of 1.0897, where today I recommend fixing the profits. Important reports on the state of the US economy in the second half of the day are published, in addition to performances of representatives of the Federal Reserve System, so the lack of demand for the euro in the area of 1.0897 may lead to a larger decline in the pair to the minimum of 1.0834, where I recommend taking the profits. If there are no active sales at the level of 1.0969, it is best to postpone short positions until the test of the maximum of 1.1033, from where you can expect a correction of 30-40 points within the day.
Signals of indicators:
Moving averages
Trading is conducted in the area of 30 and 50 daily moving averages, which indicates market uncertainty with the future direction.
Note: The period and prices of moving averages are considered by the author on the hourly chart H1 and differ from the general definition of the classic daily moving averages on the daily chart D1.
Bollinger Bands
Breaking the upper limit of the indicator to the area of 1.0955 may lead to the new growth of the euro. Whereas a break of the lower border in the area of 1.0900 will increase pressure on the euro.
Description of indicators
- Moving average (moving average determines the current trend by smoothing out volatility and noise). Period 50. The graph is marked in yellow.
- Moving average (moving average determines the current trend by smoothing out volatility and noise). Period 30. The graph is marked in green.
- MACD indicator (Moving Average Convergence / Divergence - moving average convergence / divergence) Fast EMA period 12. Slow EMA period 26. SMA period 9
- Bollinger Bands (Bollinger Bands). Period 20


