


To open long positions on GBPUSD, you need:
From a technical point of view, there were no changes in the market at all, since the pair did not touch any of the levels. Given that important fundamental statistics on the British pound are not expected today and in the afternoon, volatility will likely continue to decline, returning the pound to its normal state. The bulls are still aiming for a maximum of 1.2605, which test will keep the upward potential in the pair, which will open a direct path to the area of 1.2686, where I recommend fixing the profits. However, do not forget about the protection of the support of 1.2501, the return to which has already been outlined by the sellers of the pound in the second half of the day. Only the formation of a false breakout there will be a signal to open new long positions. It is best to buy the pound immediately on a rebound from a minimum of 1.2402.
To open short positions on GBPUSD, you need:
Sellers of the pound need to try to return the market under their control, and this can only be done after fixing below the support of 1.2501, to which the pair is gradually declining. A break in this area, just above which the moving averages pass, will increase the pressure on the pound, which will push it to the area of the minimum of 1.2402 and, quite possibly, to the larger area of 1.2294, where I recommend fixing the profits. It is worth noting that bears will not rush to enter the market at current levels and will wait for the update of the resistance of 1.2605, where the formation of a false breakout will be the first signal to open short positions in the pair. I recommend selling the pound/dollar pair immediately for a rebound only after testing the maximum of 1.2686, counting on a rebound of 40-50 points within the day.
Signals of indicators:
Moving averages
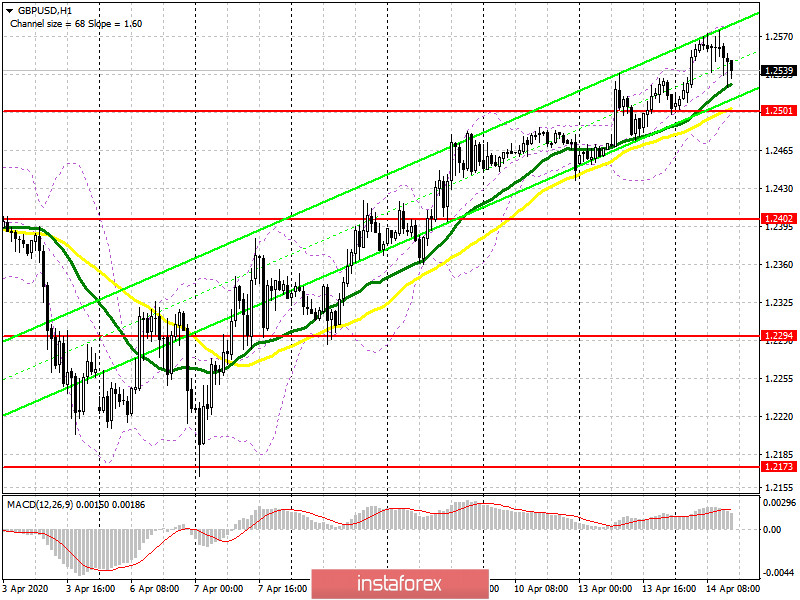
Trading is just above the 30 and 50 daily averages, which indicates that the advantage of buyers of the pound remains.
Note: The period and prices of moving averages are considered by the author on the hourly chart H1 and differ from the general definition of the classic daily moving averages on the daily chart D1.
Bollinger Bands
A break in the lower border of the indicator around 1.2501 will increase the pressure on the pound, while a break in the upper border of the indicator around 1.2575 may lead to a larger increase.
Description of indicators
- Moving average (moving average determines the current trend by smoothing out volatility and noise). Period 50. The graph is marked in yellow.
- Moving average (moving average determines the current trend by smoothing out volatility and noise). Period 30. The graph is marked in green.
- MACD indicator (Moving Average Convergence / Divergence - moving average convergence / divergence) Fast EMA period 12. Slow EMA period 26. SMA period 9
- Bollinger Bands (Bollinger Bands). Period 20


