


Trend analysis:
The price can increase this week, with the first goal of 1.0912 - a pullback level of 38.2% (blue dashed line). When breaking through which, it is possible to continue to develop with the target of 1.0956 - a pullback level of 50.0% (blue dashed line).
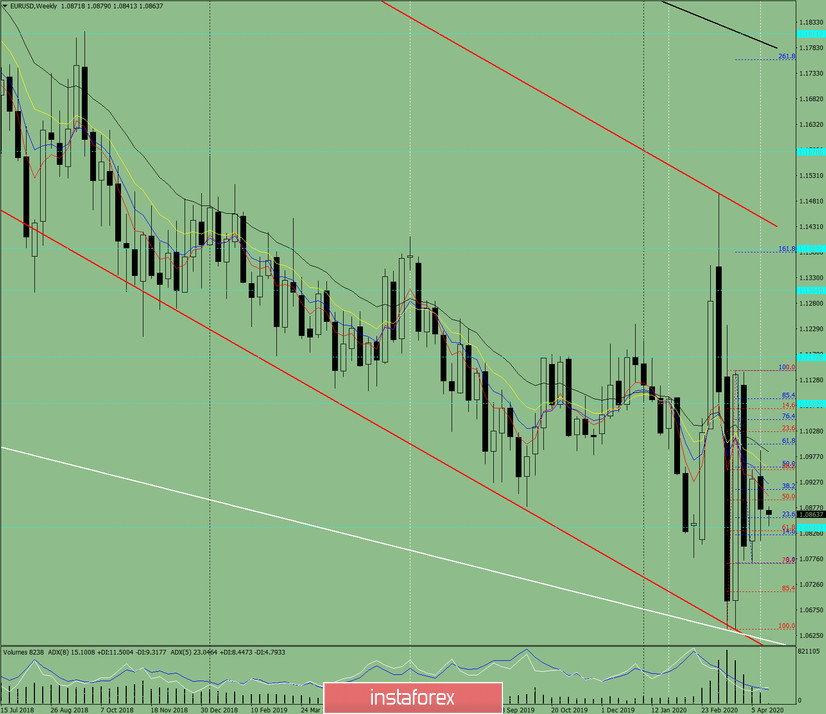
Fig. 1 (weekly schedule).
Comprehensive analysis:
- indicator analysis - up;
- Fibonacci levels - up;
- volumes - up;
- candlestick analysis - neutral;
- trend analysis - up;
- Bollinger Lines - up;
- monthly chart - down.
The conclusion of a comprehensive analysis is an upward movement.
The overall result of calculating the candle of the EUR/USD currency pair according to the weekly chart: the price of the week is likely to have an upward trend, with the presence of a lower shadow for the weekly white candlestick (Monday - down) and the presence of a second upper shadow (Friday - down). On the other hand, the weekly target of 1.1002 is a pullback level of 61.8% (blue dashed line).
An unlikely scenario: working down with the target of 1.0767 - lower fractal (blue dashed line) from a pullback level of 23.6% - 1.0857 (blue dashed line) is unlikely.


