


Good day, dear traders!
The minutes of the last meeting of the Reserve Bank of Australia was published early this morning, and a speech by RBA chief Philip Lowe was made a little later. I would like to note that the economic forecasts from the Governor of the Australian Central Bank are not encouraging.
The bank expects an economic downturn of about 10% in the first half of the year, and the same increase in the number of unemployed, namely 10%. According to the head of the RBA, a significant decline in economic activity is expected, which is not surprising, given the consequences of COVID-19 for the entire world economy, and the Australian in particular. The RBA soberly assesses the current situation and does not expect a rapid recovery of the economy after the end of the coronavirus epidemic.
Let me remind you that in March of this year, the Reserve Bank of Australia lowered the main interest rate to 0.25% and created a fund to finance medium and small enterprises for a period of three years.
If you go to the technical picture of AUD/USD, then, since this currency pair is considered once a week, it makes sense to start with a weekly timeframe.
Weekly
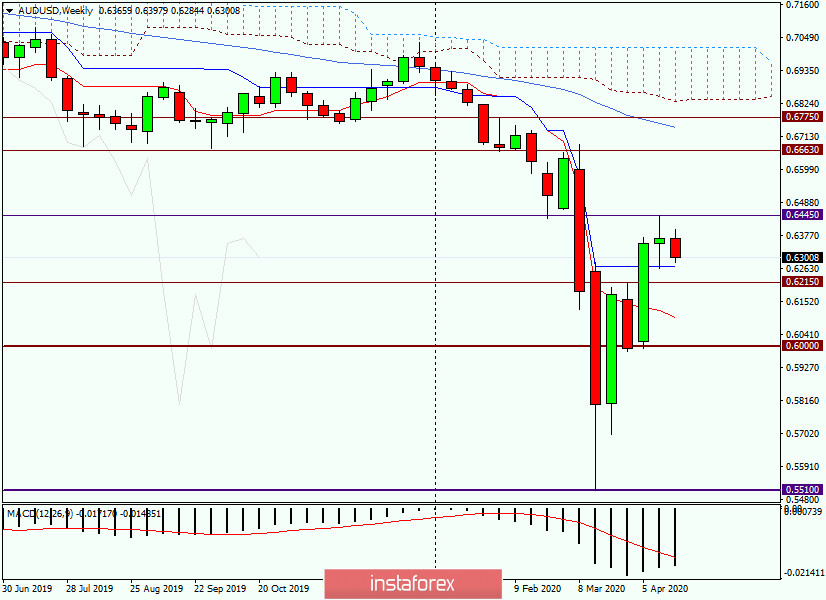
As you can see, following the results of trading on April 13-17, a "Rickshaw" candle was formed, which is a reversal model. At the time of writing this article, the pair is actually declining, but there is still plenty of time to correct the situation before the end of the week's trading.
However, given the last weekly candle, it is highly likely that the "Aussie" will continue to fall in price against the US dollar. If this happens, the nearest target of the decline will be the Kijun line of the Ichimoku indicator, which runs at 0.6271. If it is overcome, the bears will test the strength of the level of 0.6215, which was once the resistance. A more distant target for sellers of the Australian currency will be the mark of 0.6100, where the Tenkan line is located.
To return the pair to the growth that was clearly demonstrated the week before last, the bulls on the "Aussie" need to break through the resistance of sellers at 0.6445, where the maximum values of the previous weekly trading were shown. If this is done, the road will open to much higher goals, among which 0.6650 and 0.6700 can be distinguished. However, judging by the weekly chart, the most likely scenario looks like a downward one, which means that we need to look for options for selling AUD/USD.
Daily
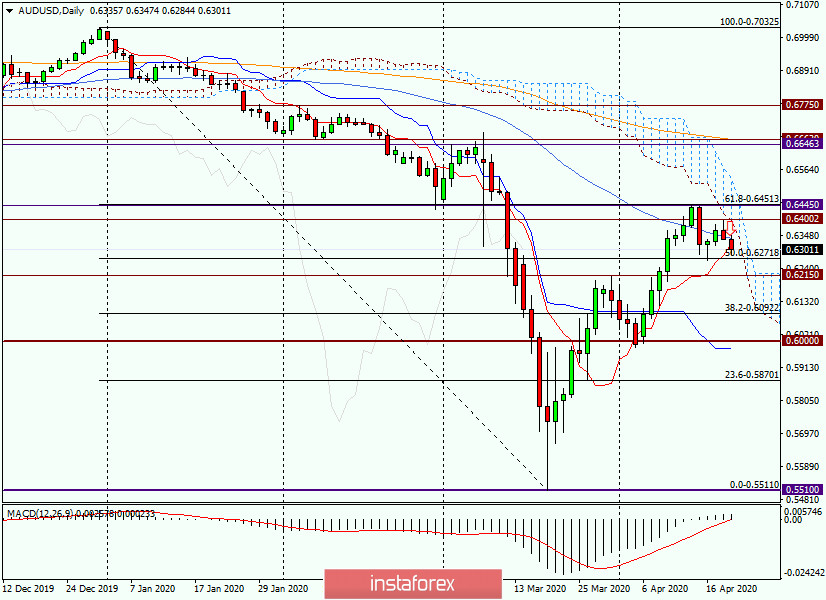
On the daily chart, we see that the pair made a deep correction to the level of 61.8 Fibo from the fall of 0.7032-0.5511, after which it turned to resume the main downward dynamics.
It is worth noting that now trading is conducted near the Tenkan line and the 50 simple moving average, on the ability to pass which will depend on the further direction of the pair. Given that the lower limit of the Ichimoku day cloud passes near the important level of 0.6400, the task for players to increase the rate becomes more difficult. As has been noted many times, both cloud borders represent quite strong support or resistance. The cloud itself is considered an area of uncertainty, and the exit from it in one direction or another usually indicates the further direction of the quote.
To avoid beating around the bush for a long time, I will immediately express my personal opinion that the main trading idea for AUD/USD is sales. I recommend considering options for opening short positions after a rollback to 0.6315, 0.6345, 0.6400, and 0.6440. As usual, the earliest sales are riskier, because the price can go higher and close the deal on the stop, and only then turn in the right direction. However, if the "Aussie" manages to rise to the area of 0.6400-0.6440, it is also not worth rushing, it is better to wait for confirming candle signals to reduce the rate.
Good luck!


