


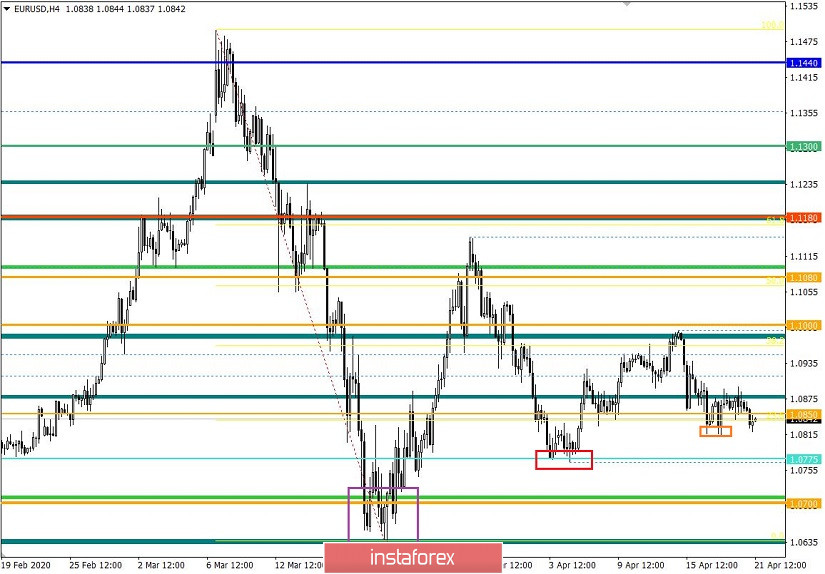
From the point of view of complex analysis, we see a continuing downward interest and during which the variable boundaries declined, and now let's talk about the details. The mirror level of 1.0850 played the role of an integral coordinate of the interaction of trade forces for a long time, at the time that the quote steadily slows down the movement, and also accelerates after its breakdown. This case was no exception. The level of 1.0850 was broken by the price, just as the quote locally accelerated, but we will talk about this a little later.
The theory of amplitude compression formed a round of oscillation once again, during which it was possible to work out about half of the previous cycle, and then there was another reversal. In the current development, we no longer record colorful bars due to the completion of the entire compression model, that is, the quote is at a conditional peak, which will eventually lead to increased activity.
In previous reviews, the turning points have already been mentioned several times, where it is necessary to break through the level of 1.0775, and for the upward level it is 1.1000 for the downward development. It is worth considering that these coordinates represent acceleration, in which the compression stroke will be violated. In turn, the critical levels of the model are the coordinates 1.0636 [DOWN] and 1.1147 [UP].
Considering the past trading day in detail, you can see a local surge in activity during the stratum of the European session, but at the same time, the quote continued to concentrate at the mirror level of 1.0850, which ended the day.
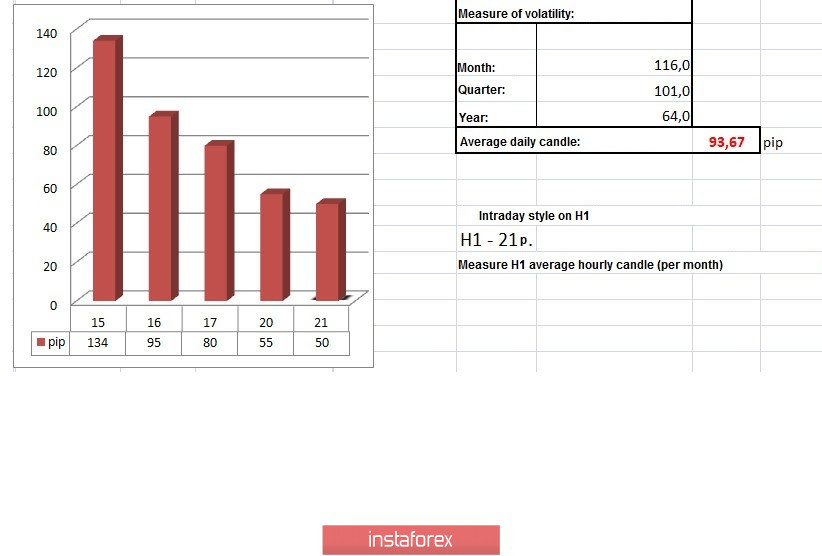
In terms of volatility, ordinary activity is recorded before the surge in the external background, where the quote showed a familiar dynamic of 55 points, which was considered the norm a year ago. Now, this is qualified as a slowdown, and the dynamics is reduced by 40% relative to the current daily average.
Do not forget that the process of normalizing volatility is already underway, in the near future the dynamics will return to the previous values of 55–70 points.
Details of volatility: Monday - 155 points; Tuesday - 183 points; Wednesday - 115 points; Thursday - 278 points; Friday - 166 points; Monday - 151 points; Tuesday - 234 points; Wednesday - 243 points; Thursday - 326 points; Friday - 194 points; Monday - 191 points; Tuesday - 160 points; Wednesday - 133 points; Thursday - 188 points; Friday - 194 points; Monday - 134 points; Tuesday - 127 points; Wednesday - 136 points; Thursday - 147 points; Friday - 91 points; Monday - 67 points; Tuesday - 142 points; Wednesday - 72 points; Thursday - 110 points; Friday - 33 points; Monday - 74 points; Tuesday - 84 points; Wednesday - 134 points; Thursday - 95 points; Friday - 80 pips; Monday - 55 points. The average daily indicator, relative to the dynamics of volatility, is 93 points [see the table of volatility at the end of the article].
As discussed in the previous review, traders considered quotes return to the area of 1.0850, which was executed by the market. The breakdown of the level was ahead of us.
Considering the trading chart in general terms, it can be seen on the daily period that the compression model is being formed in the direction of the main trend, that is, in the downward direction.
The news background of the past day contained data on the trade balance of the eurozone, where a surplus of 23.0 billion euros was recorded against the forecast of 17.5 billion euros, which played in favor of local strengthening of the single currency.
In terms of the general informational background, the most significant event was the news on the negative cost of WTI North American oil. The media twisted this news as best they could by using bad headlines. To begin with, we were talking about futures contracts for May, which locally went into the negative zone on the last day of fulfillment of the obligation. The event is rare and there is no similar scenario in history, but oil did not fall to zero. The quotes are still trading in the positive zone, and the Brent brand has not lost much. The panic did its job and so, market participants locally surrounded the US dollar, so we saw its growth during the Pacific and Asian sessions. Let me remind you that the dollar has a negative correlation with oil, that is, if black gold falls, the price of the dollar rises.
Today, in terms of the economic calendar, there is data on sales in the US secondary housing market in March, where a decrease of -8.1% is expected.
Further development
Analyzing the current trading chart, we see a breakdown of the mirror level of 1.0850, just during the local panic in the oil market during the Pacific and Asian sessions. The quote managed to decline by 30 points in just one hour during inertia, thereby bringing us closer to the minimum of April 17. In fact, this is a good signal of a possible preservation of a downward mood, which will still be able to reach the main level of 1.0775.
In terms of the emotional component of the market, speculative activity is recorded, but volatility is still below the average daily rate.
We can assume a temporary chatter within the values of 1.0815/1.0850, but as soon as the price manages to pass the level of 1.0810, the inertial movement can easily return us to the level of 1.0775.
Based on the above information, we derive trading recommendations:
- We consider selling positions lower than 1.0810, with the prospect of a movement to 1.0775. Further decline will be based on price behavior within the level of 1.0775.
- We consider buying positions in the form of an alternative transaction, in case of price consolidating higher than 1.0860, with a local perspective of 1.0880.
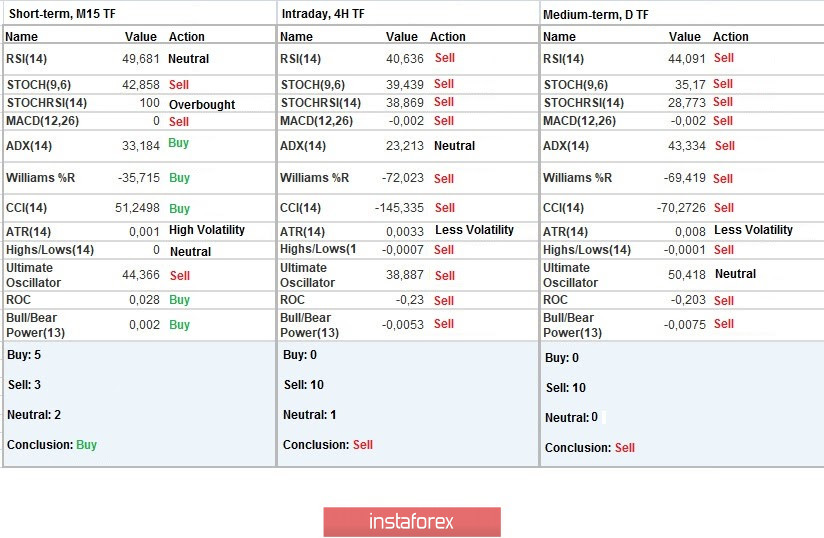
Indicator analysis
Analyzing different sectors of time frames (TF), we see that the indicators of technical instruments on hourly and daily periods are working on a decline, which confirms the general background of the market. In turn, minute intervals are at the stage of variable chatter.
Volatility per week / Measurement of volatility: Month; Quarter; Year
Volatility measurement reflects the average daily fluctuation calculated for the Month / Quarter / Year.
(April 21 was built taking into account the time of publication of the article)
The volatility of the current time is 50 points, which is 46% lower than the daily average. It can be assumed that the existing activity may double if a downward infusion is preserved.
Key levels
Resistance zones: 1.0850 **; 1.1000 ***; 1.1080 **; 1.1180; 1.1300; 1.1440; 1.1550; 1.1650 *; 1.1720 **; 1.1850 **; 1.2100
Support Areas: 1.0775 *; 1.0650 (1.0636); 1,0500 ***; 1.0350 **; 1.0000 ***.
* Periodic level
** Range Level
*** Psychological level


