


The pair traded on the lower side of the trading range on Tuesday and tested the pullback level of 74.6% - 1.0822 (presented in a blue dashed line) for the third time. Today, the downward trend may continue. Economic calendar news for the dollar is expected at 14:30 UTC. The probability of the impact of calendar news on price movements is minimal.
Trend analysis (Fig. 1).
Today, the bearish trend may continue from the level - 1.0859 (closing of yesterday's candle) with the first target at the lower fractal 1.0813. When this level is broken down, the price may continue to move downward with the target at the next lower fractal 1.0769 (presented in a red dashed line).
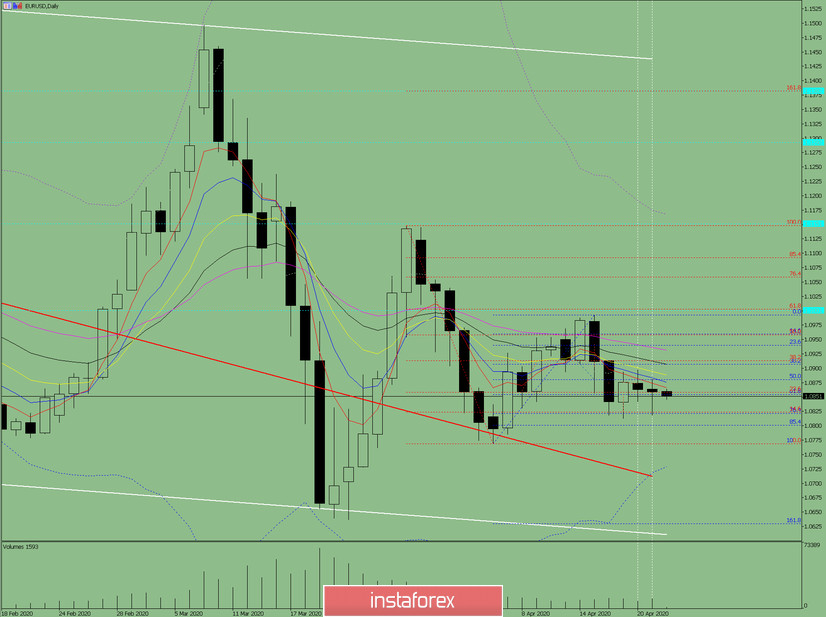
Fig. 1 (daily chart).
Comprehensive analysis:
- Indicator analysis - down;
- Fibonacci levels - down;
- Volumes - down;
- Candlestick analysis - down;
- Trend analysis - down;
- Bollinger lines - down;
- Weekly schedule - down.
General conclusion:
Today, the price may continue to move downward with the target at the lower fractal 1.0769 (presented in a red dashed line).
An unlikely bullish trend is from a retracement level of 76.4% - 1.0822 (presented in a blue dashed line) with a target at 1.0913 - a 38.2% retracement level (presented in a red dashed line).


