


Trend analysis (Fig. 1).
Today, the pair may attempt to make an upward pullback from the support line 1.2274 (presented in a red bold line) with the first target at the 21 EMA middle line of 1.2390 (presented in a black thin line). If this level is broken up, the price may continue to move upward with the target at 1.2494, a 61.8% retracement level (presented in a red dotted line).
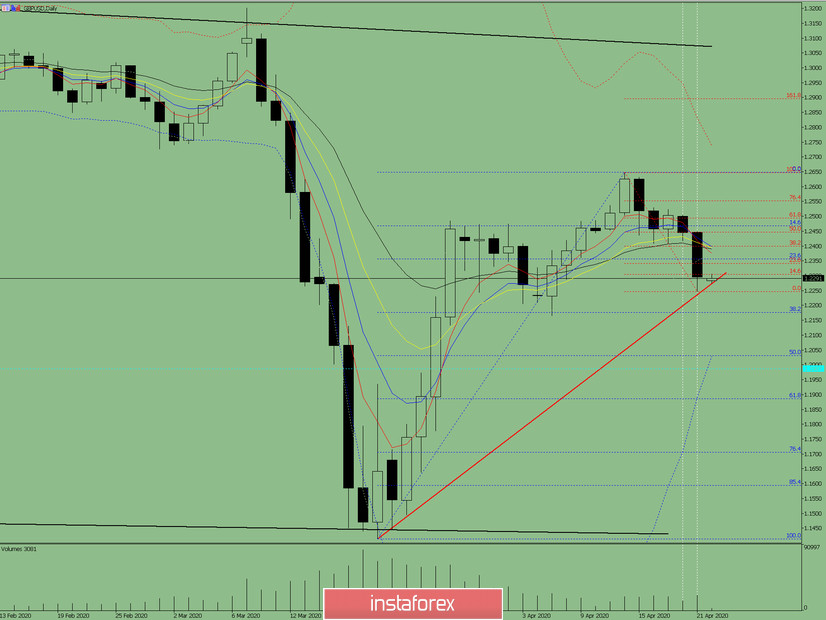
Fig. 1 (daily chart).
Comprehensive analysis:
- Indicator analysis - up;
- Fibonacci levels - up;
- Volumes - up;
- Candlestick analysis - down;
- Trend analysis - up;
- Bollinger Lines - up;
- Weekly schedule - up.
General conclusion:
Today, the price may start to move upward with the target at 1.2494 - a 61.8% retracement level (presented in a red dotted line).
The other possible scenario is a bearish trend from the support line 1.2274 (presented in a red bold line), with the target at 1.2176 - a 38.2% retracement level (presented in a blue dashed line). If this level is broken down, the price may continue to move downward with the target of 1.2031, a 50.0% retracement level (presented in a blue dashed line).


