


Technical analysis for EUR/USD and GBP/USD on April 28th
Economic calendar (Moscow time)
Today, a publication of the US consumer confidence index is the most significant macroeconomic event.
EUR/USD
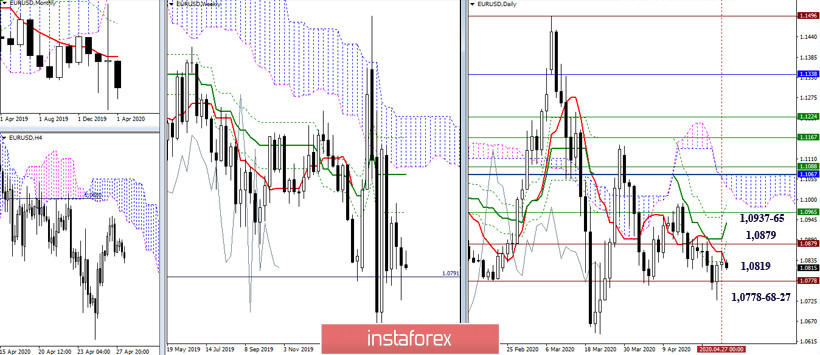
Yesterday, the euro/dollar pair did not reverse from the resistance levels. However, it slowed down. If the quote continues falling, bears will still have to test the nearest support levels located around 1.0778-68. Besides, we should also take into account that the pair may update the low of 1.0727. It is important that lines of the Ichimoku Death Cross formed an incorrect figure that signals about continuing uncertainty, consolidation, and a lack of targeted large-scale movements in the near future. Resistance levels are currently located at 1.0819 (daily Tenkan – 1.0879 (historical level + daily Fibo Kijun) – 1.0937-65 (daily Kijun + weekly Fibo Kijun).
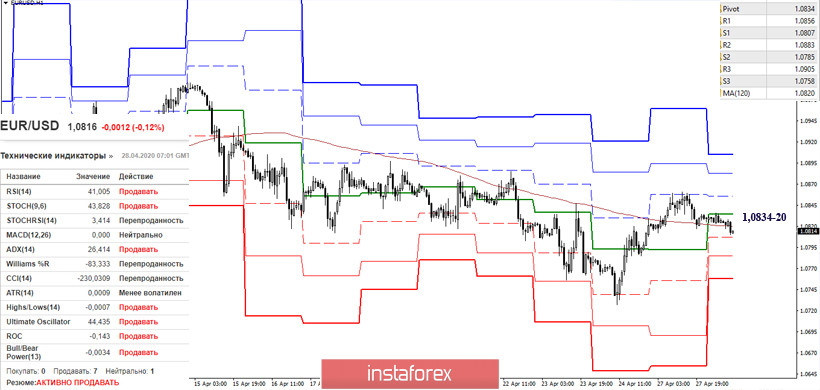
The pair has returned to the zone of influence of the key levels on smaller time frames – 1.0834-20 (Central Pivot level + weekly long-term trend). Trading near the mentioned levels will be rather uncertain. Bulls or bears will prevail depending on the pair's location in relation to these levels. Today, support is situated at 1.0807 (S1) – 1.0785 (S2) – 1.0758 (S3). If the pair resumes the downward movement (1.0727), there will be a strong signal for bears. In order to recoup losses and reach new targets, the euro/dollar pair should rise above 1.0820-34 and consolidate above the high of 1.0861.
GBP/USD
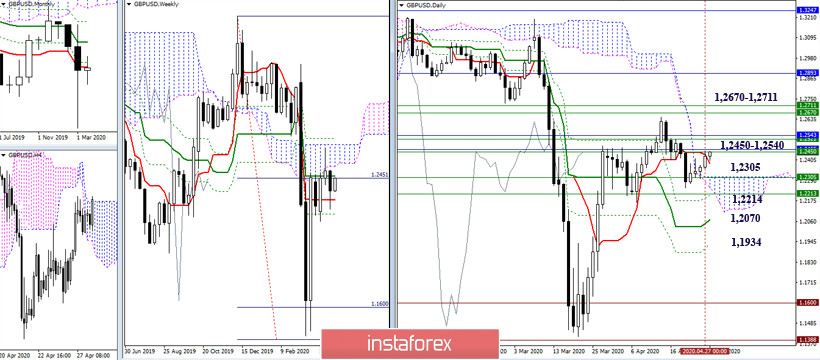
The GBP/USD pair is making an attempt to break a broad resistance zone of 1.2540-1.2450 (monthly Tenkan + weekly Kijun and Senkou span A + monthly Fibo Kijun). If it breaks through the zone, bulls may take the situation under control. Otherwise, the market will become bearish. Bears are likely to try to finish the "second shoulder" of the Head and Shoulders model (daily time frame). The nearest resistance levels are located at 1.2450-1.2540 and 1.2670-1.2711. The support levels will remain at 1.2305 – 1.2214 – 1.2070 – 1.1934.
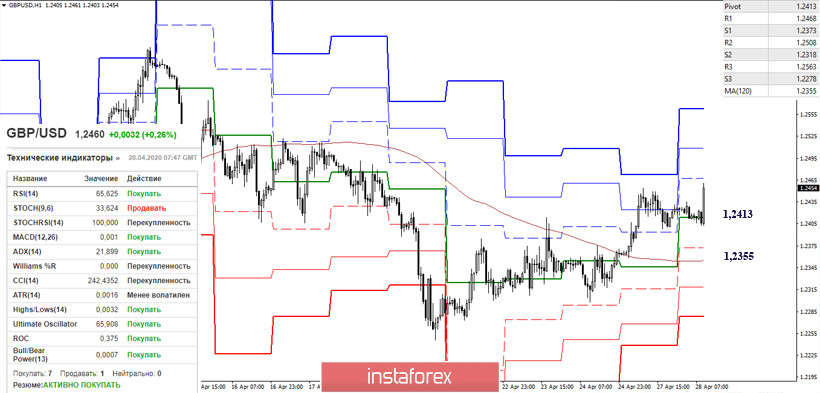
Bulls have made an attempt to change the situation. Thus, on the smaller time frames, we can again see an upward trend. Today, on a daily chart, resistance for the classical pivot levels is located at 1.2468 – 1.2508 – 1.2563. These levels are even more obvious on the bigger time frames. The key support level on the one-hour chart is at 1.2413 (central pivot level) and 1.2355 (weekly long-term tendency). If the pair returns below the mentioned support levels and consolidates there, bulls will fail to hit their targets after breaking important resistance levels.
Ichimoku Kinko Hyo (9.26.52), Pivot Points (classical), Moving Avarage (120)


