


GBP/USD
Analysis:
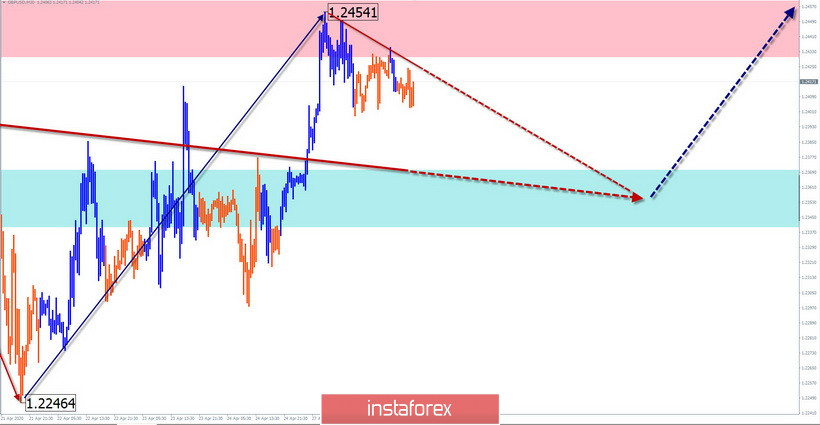
Since March 18, the direction of the British pound's trend looks to the "North" of the chart. On April 21, the final section (C) started. It forms an intermediate pullback, at the end of which the price rise will continue.
Forecast:
During the current day, the downward movement is expected to end. At the end of the day, a reversal and the beginning of price growth is expected in the area of settlement support.
Potential reversal zones
Resistance:
- 1.2430/1.2460
Support:
- 1.2370/1.2340
Recommendations:
Short-term sales of the pound are possible today. When the reversal signals appear in the support area, you should change the direction of transactions. It is better to reduce the lot in transactions.
USD/JPY
Analysis:
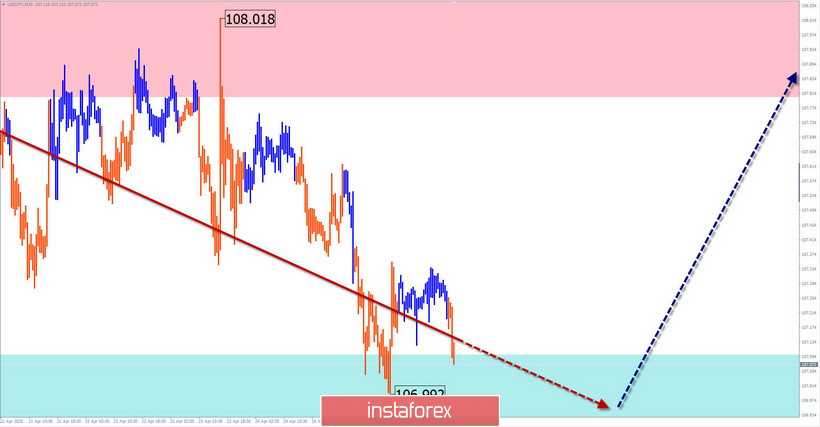
Since the beginning of March, the direction of the price movement of the Japanese yen is set by an ascending wave algorithm. The price is adjusted for the entire current month, forming a "descending pennant" figure on the chart. The correction is close to completion.
Forecast:
Today, the price movement is likely in the corridor between the nearest counter zones. After an attempt to pressure the support zone, the exchange rate is expected to change in the upcoming session and the beginning of a price rise.
Potential reversal zones
Resistance:
- 107.80/108.10
Support:
- 107.10/106.80
Recommendations:
There are no conditions for selling the yen today due to the limited potential for a decline. When reversal signals appear, it is recommended to look for signals to enter long positions.
Explanation: In the simplified wave analysis (UVA), waves consist of 3 parts (A-B-C). The last incomplete wave is analyzed. The solid background of arrows shows the formed structure, and the dotted ones show the expected movements.
Note: The wave algorithm does not take into account the duration of the tool movements in time!


