


To open long positions on EURUSD, you need:
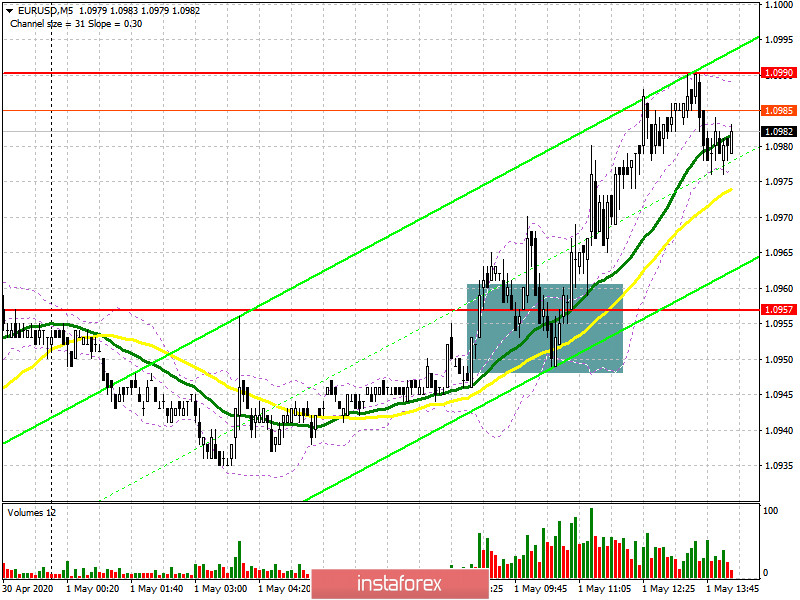
In my morning forecast, I paid attention to the high probability of a breakout of the level of 1.0957 and recommended opening long positions after that in the expectation of continuing growth to the resistance of 1.0990, which happened. If you look closely at the 5-minute chart, you can see how the bulls fail to hold this level the first time after the breakout of 1.0957 and the trade moves down again for a while. However, buyers still break higher, which forms a large wave of growth of EUR/USD to the maximum of 1.0990. It was possible to open long positions only after the pair returned to the level of 1.0957 again. At the moment, the bulls are focused on the breakdown of the resistance of 1.0990, although the bears strongly oppose this, and the divergence has clearly formed on the MACD indicator. I recommend opening long positions from this level only after fixing them higher, by analogy, as it was with the level of 1.0957. Only then can you expect to update the highs of 1.1040 and 1.1093, where I recommend fixing the profit. In the scenario of a decline in EUR/USD in the second half of the day, you can look at purchases only after a correction to the support area of 1.0957 or open long positions immediately on a rebound from the minimum of 1.0922.
To open short positions on EURUSD, you need:
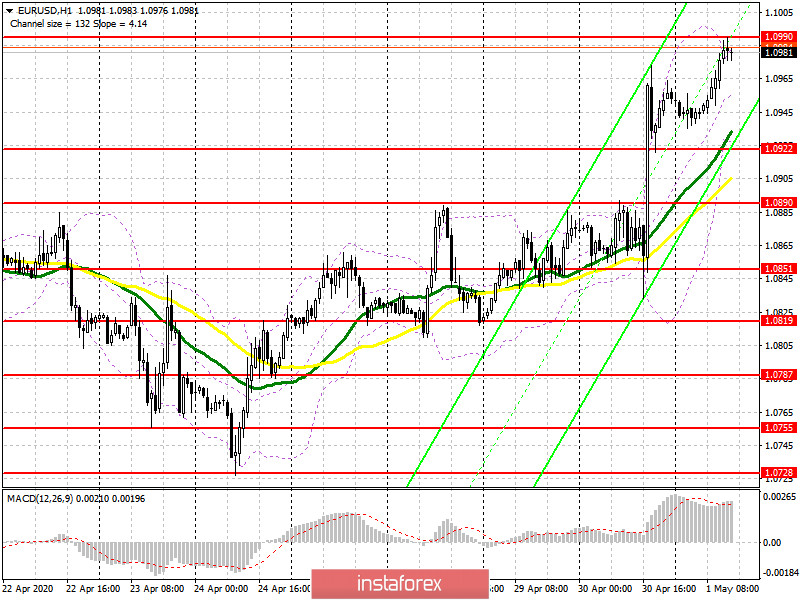
Sellers of the euro have so far responded with short positions from the level of 1.0990 and have not allowed the pair to break above this range. Most likely, the entire focus will be shifted to data on manufacturing activity in the US. Poor indicators may discourage the bulls from further pushing the pair up, which will lead to a downward correction to the support area of 1.0957. Fixing below this level will quickly push EUR/USD to the larger area of 1.0922, where I recommend fixing the profits. Just above this level, the moving averages also pass. In the scenario of further growth of the pair above the resistance of 1.0990, it is best to look at short positions only after updating the maximum of 1.1040 in the expectation of correction of 30-40 points by the close of the trading week.
Signals of indicators:
Moving averages
Trading is conducted above the 30 and 50 daily moving averages, which indicates that the market is controlled by buyers.
Note: The period and prices of moving averages are considered by the author on the hourly chart H1 and differ from the general definition of the classic daily moving averages on the daily chart D1.
Bollinger Bands
The upper limit of the indicator in the area of 1.0990 has already worked out today and now it is the lower limit in the area of 1.0930, which will be sought by sellers of the euro.
Description of indicators
- Moving average (moving average determines the current trend by smoothing out volatility and noise). Period 50. The graph is marked in yellow.
- Moving average (moving average determines the current trend by smoothing out volatility and noise). Period 30. The graph is marked in green.
- MACD indicator (Moving Average Convergence / Divergence - moving average convergence / divergence) Fast EMA period 12. Slow EMA period 26. SMA period 9
- Bollinger Bands (Bollinger Bands). Period 20


