


The price in April, moving down, tested the historical support level of 1.2157 (presented in a white dashed line) and then increased. Due to the combination of technical and fundamental analysis directions, the price made an upward rally (425 points) after the rebound from the support level and then tested the historical resistance level of 1.2650 (presented in a white dashed line).
Trend analysis.
In May, a downward movement with the first target of 1.2464 is possible from the level of 1.2590 (closing of the April monthly candlestick) - a pullback level of 14.6% (blue dashed line). If this level is broken down, we will continue to the next lower target - a pullback level of 23.6% - 1.2353 (blue dashed line). If this level is broken down, a downward movement is likely to the pullback level of 38.2% - 1.2373 (blue dashed line) and then continue to develop upwards.
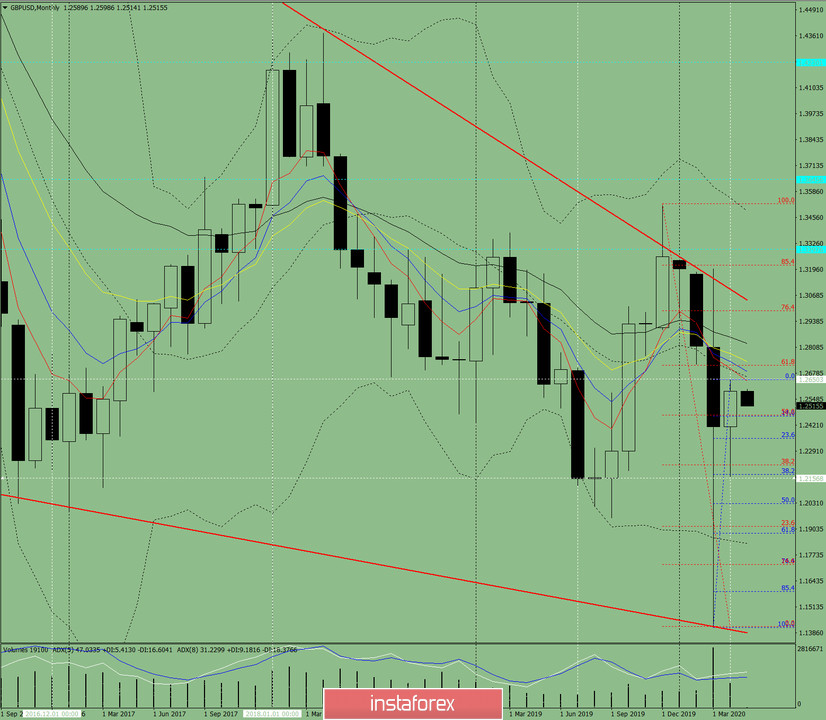
Fig. 1 (monthly chart).
Indicator Analysis:
- indicator analysis - down;
- Fibonacci levels - down;
- volumes - down;
- candlestick analysis - down;
- trend analysis - down;
- Bollinger lines - down;
The conclusion of a comprehensive analysis is possible bottom.
The total result of calculating the candle of the GBP/USD currency pair according to the monthly chart: the price will most likely have a downward trend with the absence of the first upper shadow (the first week of the month is black) and the absence of the second lower shadow (last week is black).
The lower target: 1.2373 - 38.2% - a pullback level (blue dashed line), from which we will continue to work upwards.
An unlikely scenario: an upward movement with the target of 1.2715 - a pullback level of 61.8% (red dashed line) from a pullback level of 14.6% -1. 2464 (blue dashed line) is unlikely.


