


To open long positions on GBPUSD, you need:
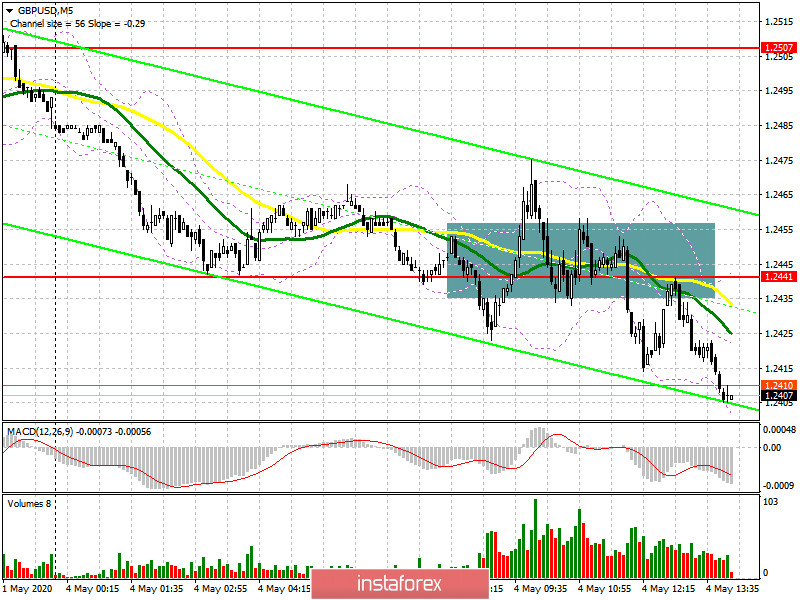
In the morning, everything happened exactly as I expected. The bulls tried to make a false breakout of the support of 1.2441 and build a larger upward correction, but nothing came of it. If you look at the 5-minute chart, you will see how, after a false breakdown and upward movement from the level of 1.2441, pound buyers tried several times to resume the pair's growth, but could not even update the correction maximum, which ultimately led the pair to return to the area of 1.2441 and further sale of GBP/USD. At the moment, the task of the bulls is to return to the resistance of 1.2441, since only in this case can we expect an upward correction to the resistance of 1.2507, where I recommend fixing the profits. However, it is best to postpone long positions until the decline to the support area of 1.2391, provided that a false breakout is formed there. But I recommend buying the pound immediately for a rebound from the minimum of 1.2347 in the expectation of correction of 30-40 points within the day.
To open short positions on GBPUSD, you need:
Sellers coped perfectly with the morning task and after active purchases returned the pair to the level of 1.2441, the test of which from the bottom up (see the 5-minute chart) was a good signal to open short positions in the expectation of continuing the decline of the pound to the minimum of 1.2391, where the pair is now aiming. A break in this range will quickly push GBP/USD to the next area of 1.2347, where I recommend fixing the profits. If the bulls make another attempt to regain the resistance of 1.2441, and this cannot be excluded, since in the second half of the day there is no expected release of important fundamental statistics, then it is best to return to short positions only for a rebound from the daily maximum in the area of 1.2507, where the moving averages are located. Also, do not forget that the sellers managed to break the upward trend formed on April 21, and closing the day below the level of 1.2441 will only increase the pressure on the pair.
Signals of indicators:
Moving averages
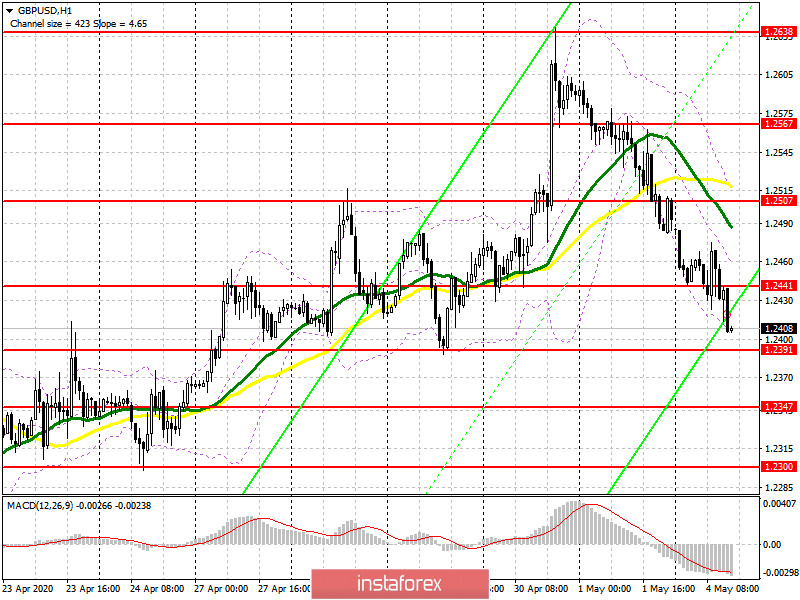
Trading is below the 30 and 50 daily averages, which indicates the formation of a new bear market.
Note: The period and prices of moving averages are considered by the author on the hourly chart H1 and differ from the general definition of the classic daily moving averages on the daily chart D1.
Bollinger Bands
A break in the lower border of the indicator around 1.2415 will increase the pressure on the pound. Growth will be limited by the upper level of the indicator in the area of 1.2507, from where you can sell immediately on the rebound.
Description of indicators
- Moving average (moving average determines the current trend by smoothing out volatility and noise). Period 50. The graph is marked in yellow.
- Moving average (moving average determines the current trend by smoothing out volatility and noise). Period 30. The graph is marked in green.
- MACD indicator (Moving Average Convergence / Divergence - moving average convergence / divergence) Fast EMA period 12. Slow EMA period 26. SMA period 9
- Bollinger Bands (Bollinger Bands). Period 20


