


Hello, dear colleagues!
In yesterday's trading, the US dollar strengthened across a wide range of the market. Do not avoid the weakening of the single European currency. As a result, the main currency pair of the Forex market declined significantly and ended trading on May 4 at 1.0906.
It is possible that the market sentiment was seriously affected by a new round of confrontation between the United States and China after the comments of the American side. Let me remind you that earlier US President Donald Trump, followed by Secretary of State Mike Pompeo, accused Beijing of misinformation about COVID-19 and its negative consequences for the entire world community. Moreover, the US Secretary of State said that the coronavirus was created in a laboratory in the Chinese city of Wuhan, where it began its deadly world tour. The statement is quite controversial and ambiguous, but, according to Pompeo, there is evidence. However, in 2003, a test tube of the then Secretary of State of the United States, Colin Powell, whom he frantically shook at the UN Security Council, was also considered evidence that there were chemical weapons in Iraq. This turned out to be an outright lie and a reason to take military action against Iraq. After many years, in his defense, Powell admitted that he was misled by the CIA. By the way, this is exactly the department that was headed by the current Secretary of State Mike Pompeo.
In the situation with accusations against China, no one was shaking any test tubes, but the high probability of tightening trade relations between Washington and Beijing scared investors and forced them to look for safe havens. In such a mood, the US dollar was very much in demand as a protective asset.
In fairness, we must recognize that market sentiment is subject to frequent changes. This has always been the case, in the current situation with the spread of COVID-19 on the planet, investor sentiment is subject to even more frequent changes.
If you look at the economic calendar, you can once again see those market participants often simply ignore the fundamental factors. This has already been noted more than once. Another example of such indifference in macroeconomic reports was yesterday's data from the US on production orders, which came out worse than expected minus 9.8%, and in fact, amounted to minus 10.3%. As we can see, this did not put pressure on the US currency, at least in a pair with the euro.
Today, at 10:00 (London time), the Eurozone will publish the producer price index, and during the US session, the US will release data on the trade balance, the index of business activity in the services sector from the Institute for Supply Management (ISM). Members of the Open Market Committee, Bullard and Bostic, are also scheduled to speak. All details are in the economic calendar. And now it is time to consider the charts of the euro/dollar currency pair.
Daily
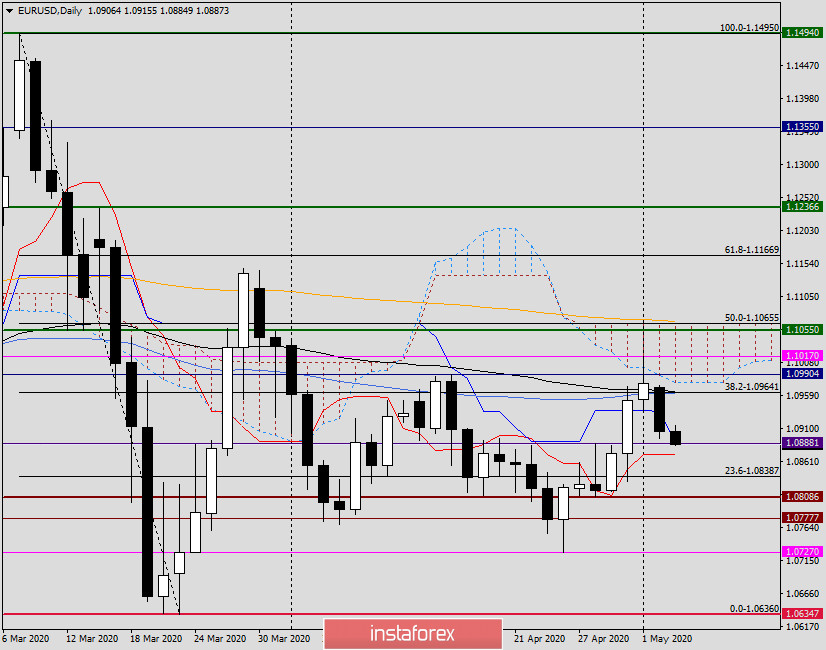
As you can see, the pair was not able to overcome the resistance provided by the growth of 50 MA and 89 EMA in the area of 1.0965. As a result of yesterday's decline, the pair came to strong support near 1.0890. Here is the Kijun line of the Ichimoku indicator and the level of 1.0888, the breakdown of which will send the quote to test the Tenkan line, which runs at 1.0872. An even more distant target for sellers will be the mark of 1.0833, where the minimum trading values are indicated on April 30.
If the market is dominated by the euro bulls today, we can expect a rise in EUR/USD to the price zone of 1.0965-1.0978, where there are 89 EMA and the lower limit of the daily Ichimoku cloud. These are the goals of the daily chart. We go further.
H4
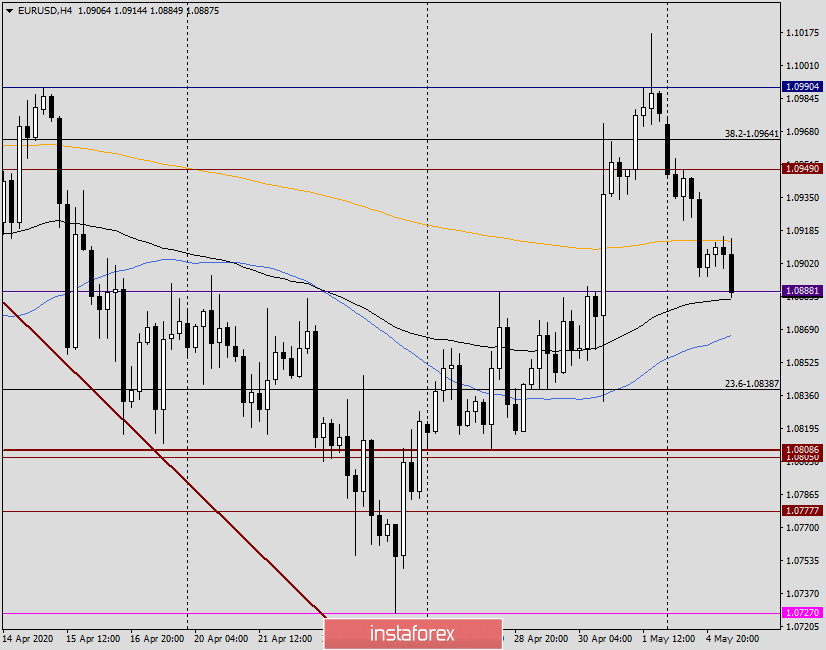
The pair has settled under 200 EMA (orange) for more than three candles in a row, which may mean a further decline in the quote. In this case, the next targets will be 89 EMA and 50 MA, which are at 1.0885 and 1.0865, respectively. From the indicated marks, you can expect a rebound or reversal of the course, which is signaled by the characteristic candlestick patterns.
If you enter the market based on H4, I recommend considering two options. Attempts to break up the 200 EMA are unsuccessful, which will give grounds for selling with the nearest targets at 1.0885 and 1.0865. The second option implies a return of the pair above 200 EMA, fixing above this exponential moving average, after which, on a pullback to 200 EMA, you can try buying with goals in the area of 1.0960-1.0980.
H1
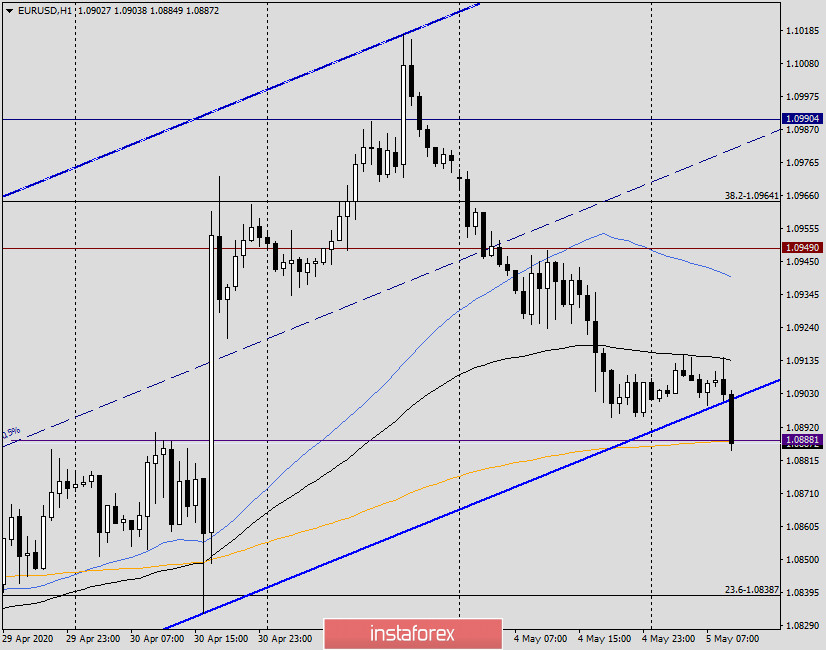
As another option for opening sales, we wait for the true breakdown of the lower border of the ascending channel, the support level of 1.0888 is 200 EMA, after which we consider selling the single European currency at a rollback to the price zone of 1.0885-1.0900. If bullish models (or a model) of candle analysis appear in the designated price zone, you should already think about buying.
As you can see and understand, there are no clear recommendations regarding positioning at the moment, both scenarios still remain relevant. A lot will depend on whether the support zone of 1.0888-1.0865 can withstand the pressure of sellers.
Good luck!


