


GBP/USD
Analysis:
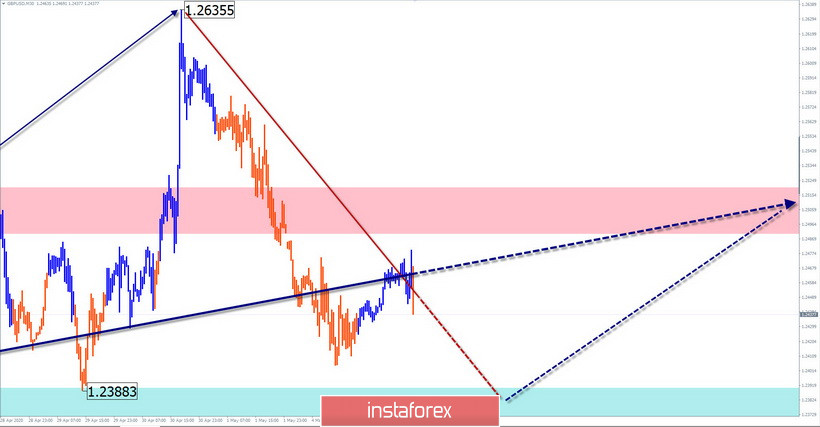
In the short term, an upward wave has been forming on the chart of the British pound since mid-March. In its structure, the conditions for the final upward leap are being finalized. The nearest stop is the area around the 128th figure. Yesterday's rise has a reversal potential.
Forecast:
In the next trading sessions, the movement is expected to complete the outgoing mood, form a reversal, and start a price rise. The upper limit of the daily range shows the zone of calculated resistance. A break in its upper limit within a day is unlikely.
Potential reversal zones
Resistance:
- 1.2490/1.2520
Support:
- 1.2420/1.2390
Recommendations:
Trading the pound on the market today is only possible with an intraday style. When selling, you should take into account the limited reduction potential. After the appearance of reversal signals, it is recommended to focus on buying the pair.
USD/JPY
Analysis:
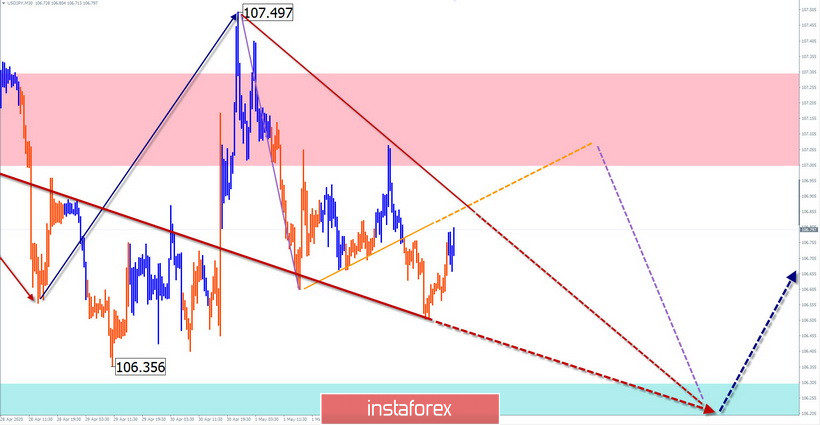
The direction of the Japanese yen in the last 2 months is set by a downward wave. In the larger model from March 9, it takes the place of correction. The wave entered its final phase. The price is close to the upper limit of the strong reversal zone.
Forecast:
In the next trading session, the price is expected to increase in the area of the calculated resistance zone. Then you can wait for a change of course and a repeated decline to the support zone.
Potential reversal zones
Resistance:
- 107.00/107.30
Support:
- 106.30/106.00
Recommendations:
Trading on the pair's market today is only possible within the intraday framework. When purchasing, you should reduce the trading lot.
Explanation: In the simplified wave analysis (UVA), waves consist of 3 parts (A-B-C). The last incomplete wave is analyzed. The solid background of the arrows shows the formed structure, and the dotted one shows the expected movements.
Note: The wave algorithm does not take into account the duration of the tool movements in time!


