


To open long positions on EURUSD, you need:
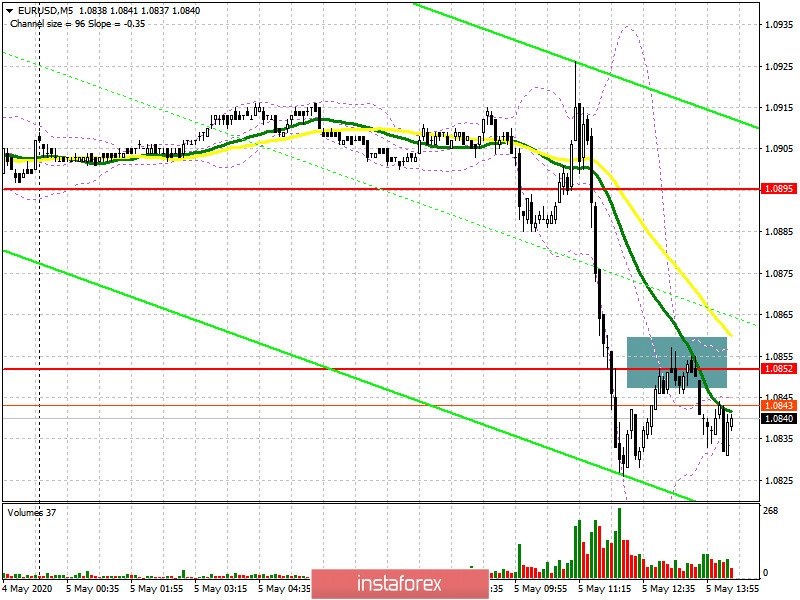
The 5-minute chart shows the morning false breakout, which was a signal to buy the euro. However, as we can see, it was not possible to build a larger upward trend. This morning, I drew attention to the decision of the German Constitutional Court, which led to a surge in volatility. I expected the euro to rise after the results were published, but even the decision that the ECB does not violate the laws of the old caused a strong downward movement. It seems that the current situation in the Eurozone does not inspire new investors to buy euros. At the moment, buyers need to return the resistance of 1.0852, below which they are currently trading. Only fixing above this range will lead to a larger upward correction in the area of 1.0895, and the further goal of the bulls will be a maximum of 1.0945, where I recommend fixing the profits. If the pressure on the euro continues, it is best to return to long positions on the support test of 1.0811 or buy immediately for a rebound from the minimum of 1.0787, in the expectation of an upward correction of 25-30 points at the end of the day.
To open short positions on EURUSD, you need:
Sellers are fully in control of the resistance of 1.0852, which can be seen on the 5-minute chart. While trading will be conducted below this range, we can expect a continuation of the downward trend in the pair, which will lead to the renewal of new lows in the area of 1.0811 and 1.0787, where I recommend fixing the profits. An additional driver for the fall in the euro will be poor data on the US non-manufacturing activity index, which is expected in the afternoon. In the scenario of the bulls returning to the level of 1.0852, it is best to return to new short positions immediately on the rebound from the maximum of 1.0895, and you can also sell the pair after the resistance test of 1.0945 in the expectation of correction of 30-35 points within the day. The next formation of a false breakout in the resistance area of 1.0852 will be a signal to open short positions.
Signals of indicators:
Moving averages
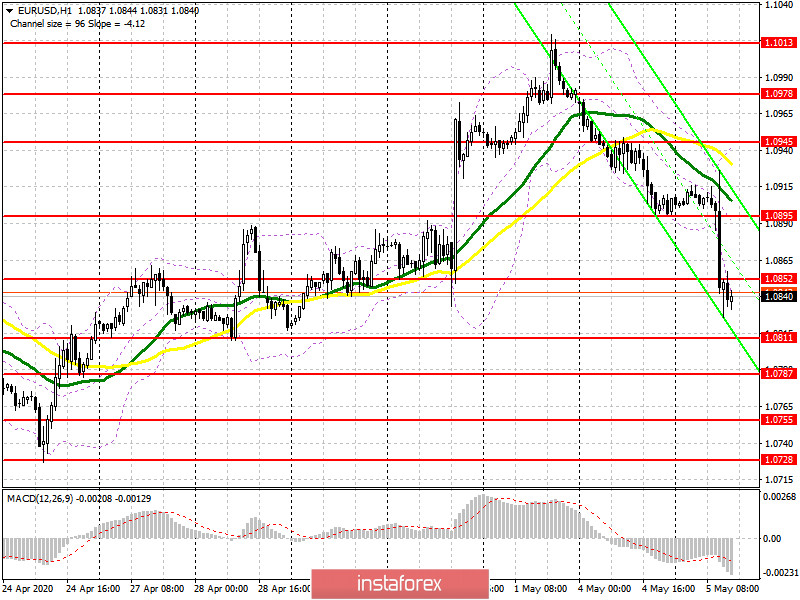
Trading is below the 30 and 50 daily moving averages, which indicates a continuation of the bear market.
Note: The period and prices of moving averages are considered by the author on the hourly chart H1 and differ from the general definition of the classic daily moving averages on the daily chart D1.
Bollinger Bands
In the case of an upward correction, the average border of the indicator around 1.0895 will act as a resistance, and you can sell immediately on a rebound from the upper border in the area of 1.0940.
Description of indicators
- Moving average (moving average determines the current trend by smoothing out volatility and noise). Period 50. The graph is marked in yellow.
- Moving average (moving average determines the current trend by smoothing out volatility and noise). Period 30. The graph is marked in green.
- MACD indicator (Moving Average Convergence / Divergence - moving average convergence / divergence) Fast EMA period 12. Slow EMA period 26. SMA period 9
- Bollinger Bands (Bollinger Bands). Period 20


