


To open long positions on GBPUSD, you need:
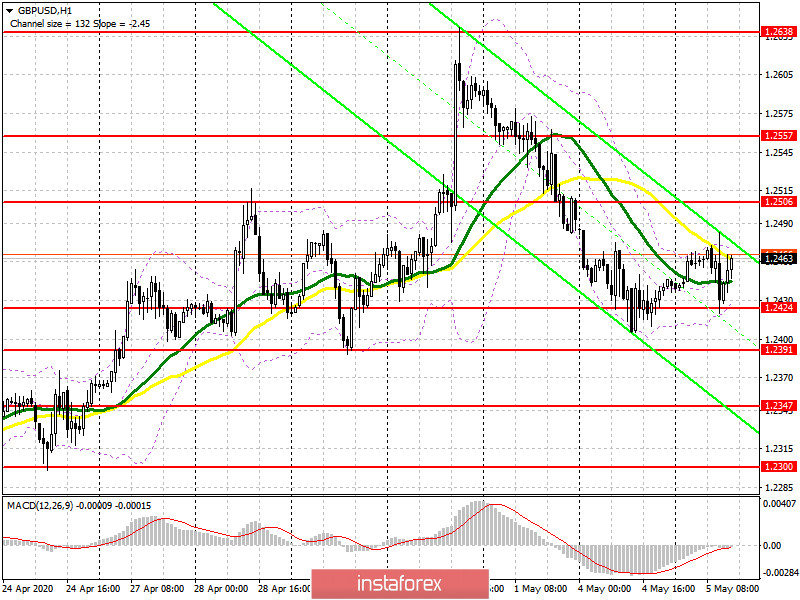
In my morning forecast, I recommended opening short positions on the pound after a return and consolidation under the support level of 1.2441. However, although the scenario was fully implemented, where this level was also tested from the bottom up on the volume, a larger movement of the pound down did not occur, which led to the pair returning to the area of 1.2441 and a complete revision of the current supports and resistances. The PMI for the services sector in April was slightly better than economists' forecasts, which could prevent a bearish impulse in the first half of the day. At the moment, while the bulls hold the area of 1.2424, you can expect a larger upward correction based on the test of the maximum of 1.2506, where I recommend fixing the profit. Another false breakout formation at 1.2424 after the release of the ISM report for the US non-manufacturing sector will be a signal to buy the pound. Fixing above the resistance of 1.2506 will only strengthen the position of the bulls, which will open a direct road to the highs of 1.2557 and 1.2638. If the pressure on the pound persists in the second half of the day, and the bulls miss the support of 1.2424, it is best to look at long positions after the test of 1.2391 or buy the pair immediately on the rebound from the minimum of 1.2347.
To open short positions on GBPUSD, you need:
Sellers of the pound face another important task to break through and consolidate below the support of 1.2424 since only this scenario will preserve a bearish momentum in the market, which can push GBP/USD to the lows of 1.2391 and 1.2347, where I recommend fixing the profits. Weak data on the US ISM index may contribute to this. In the scenario of the pound's growth in the second half of the day, it is best to return to short positions on the rebound from the resistance of 1.2506 or sell the pair immediately from the maximum of 1.2557 in the calculation of a downward correction of 30-40 points within the day. However, be careful, as a break in the resistance of 1.2506 will be a verdict for sellers of the pound, as the short-term downward trend in the pair will be broken.
Signals of indicators:
Moving averages
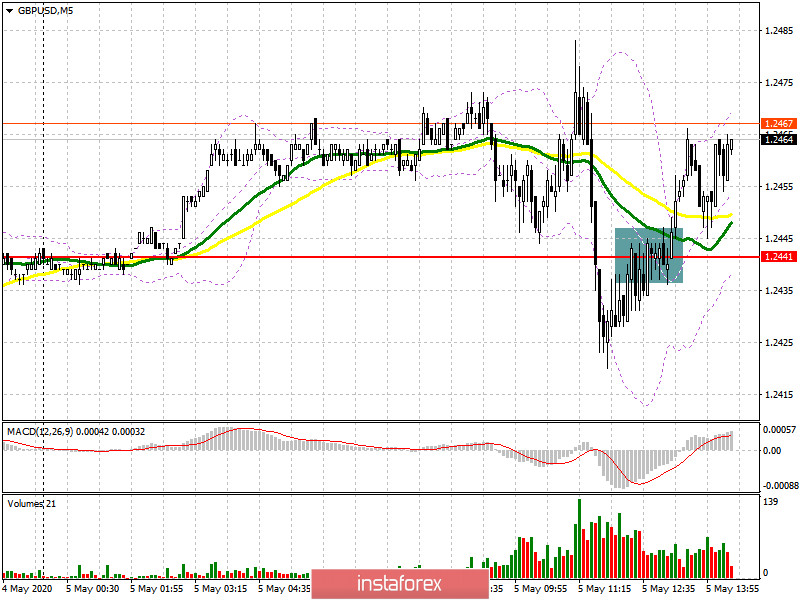
Trading is conducted in the area of 30 and 50 daily averages, which indicates some confusion among sellers.
Note: The period and prices of moving averages are considered by the author on the hourly chart H1 and differ from the general definition of the classic daily moving averages on the daily chart D1.
Bollinger Bands
A break in the lower border of the indicator around 1.2424 will increase the pressure on the pound. A break of the upper limit in the area of 1.2475 will lead to a larger upward movement of the pair.
Description of indicators
- Moving average (moving average determines the current trend by smoothing out volatility and noise). Period 50. The graph is marked in yellow.
- Moving average (moving average determines the current trend by smoothing out volatility and noise). Period 30. The graph is marked in green.
- MACD indicator (Moving Average Convergence / Divergence - moving average convergence / divergence) Fast EMA period 12. Slow EMA period 26. SMA period 9
- Bollinger Bands (Bollinger Bands). Period 20


