


To open long positions on GBP/USD:
In my morning forecast, I recommended opening short positions on the pound after it broke through the support level of 1.2424. Bears managed to do so in the first half of the day and hit the level of 1.2360.
Although the price didn't try to break through this level to the upside on the high volume, it entered the line according to the trend. Besides, the price was long going to break through the 1.2424 level. If you look at the 5-minute chart, you will see that the bulls were trying to return after the pair settled below the level of 1.2424, but they failed to do so. The low of 1.2391 didn't stop the pound from edging lower. As a result, the British currency plunged and tested the level of support at 1.2360 where I recommended buying GBP/USD immediately after a rebound. So far, the current upward correction has brought almost 30 pips. But the bulls will further aim to return to the level of resistance at 1.2424. I recommend taking profit there. If the pound continues to decline, especially on the negative fundamental data from the US, it is best to return to long positions only after testing the next low at 1.2327. Otherwise, it is worth buying the pair immediately after it rebounds from the support level at 1.2300, adjusted for an intraday correction of 30-40 pips. In case of a breakthrough and consolidation above the level of 1.2424, the GBP/ USD pair can jump to the high of 1.2478, so keep this in mind.
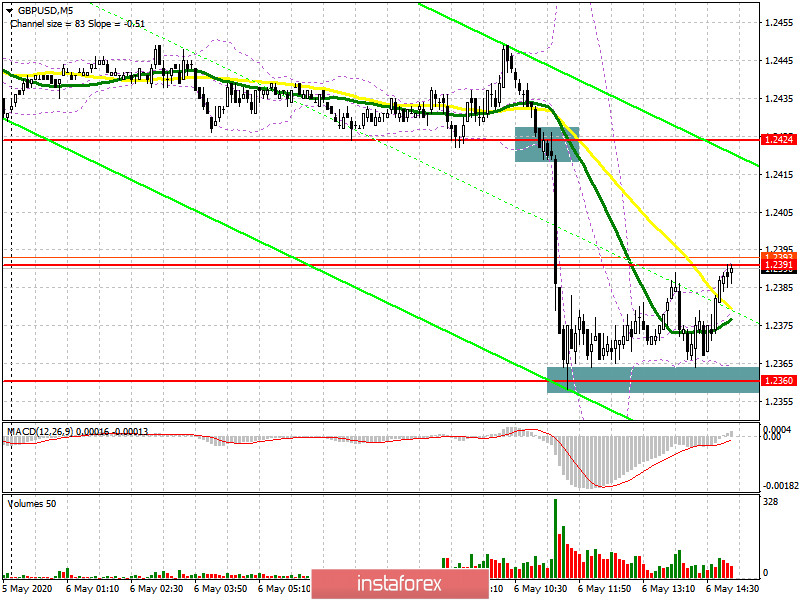
To open short positions on GBP/USD :
The bears coped with the task in the first half of the day and managed to reach the level of 1.2360. At the moment, their target lies in this range. In case of a retest of this range, the price will probably break through it. If the price consolidates below this range, it will be a good signal to open short positions in order to update the lows of 1.2327and 1.2300 where I recommend taking profit. A better scenario to sell the pound will be an upward correction to the resistance level at 1.242. There, the formation of a false breakthrough will lead to a new round of short positions. If the bears display no activity at 1.2424, it is best to postpone placing short positions until the price tests the high of 1.2478, keeping in mind an intraday downward correction of 30-40 pips.
Indicator signals:
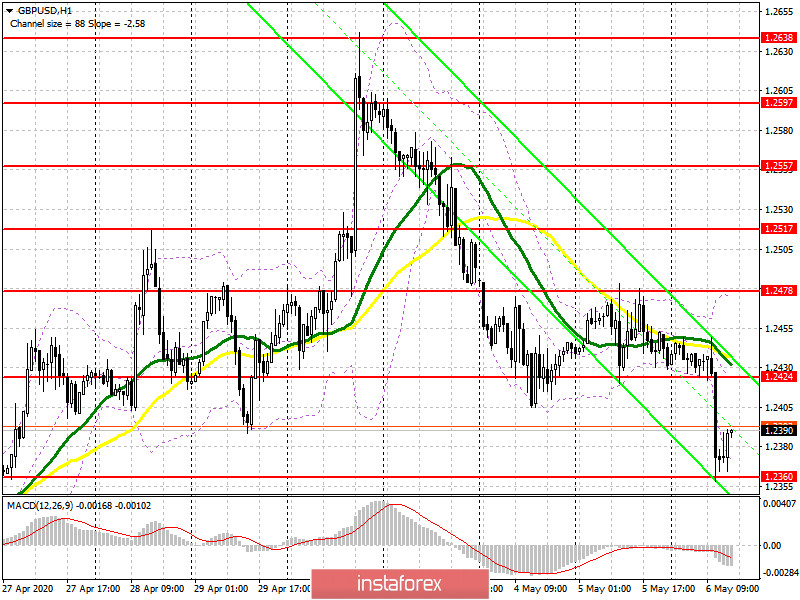
Moving averages
Trading takes place below 30-day and 50-day moving averages which indicates a further decline of the pound.
Note: The period and prices of moving averages are considered according to the H1 hourly chart and differs from the general definition of the classic daily moving averages on the daily chart D1.
Bollinger bands
A breakthrough of the lower boundary of the indicator at 1.2365 will increase pressure on the pound. With an upward correction, the average boundary of the indicator at 1.2424 will serve as a level of resistance.
Description of indicators
• Moving average (moving average determines the current trend by smoothing out volatility and noise). Period of 50 days. On the chart, it is marked in yellow.
• Moving average (moving average determines the current trend by smoothing out volatility and noise). Period of 30 days. On the chart, it is marked in green.
• MACD indicator (Moving Average Convergence / Divergence - moving average convergence / divergence). Fast EMA period 12. Slow EMA period 26. SMA period 9.
• Bollinger Bands (Bollinger Bands). Period of 20 days.


