


To open long positions on GBPUSD, you need:
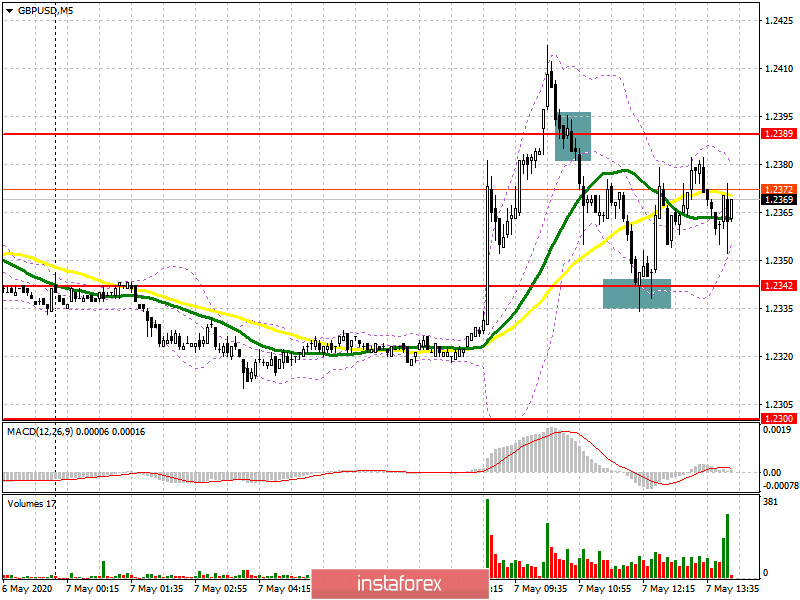
If you look at the 5-minute chart, you will see how the morning buy signal above 1.2342 failed to confirm itself, because, after the decision of the Bank of England to leave the volume of the asset purchase program unchanged, the pound strengthened sharply, and then the resistance test of 1.2389, from where I recommended opening short positions immediately on the rebound. Those who did not have a chance to join the pair after returning to the level of 1.2389. I marked the point on the 5-minute chart. However, the buyers did not stand aside, and by the middle of the day, they managed to protect the level of 1.2342, forming a good signal to open long positions in the continuation of the upward correction, which, according to my plan, should have formed after the first breakdown at the beginning of the European session. While trading will be above the range of 1.2342, we can count on a second test and a breakthrough of the resistance of 1.2389, from which GBP/USD will continue to grow to the highs of 1.2446 and 1.2478, where I recommend taking the profits. If the bears are able to regain support for 1.2342, it is best to postpone long positions until the low of 1.2300 is updated, or buy GBP/USD immediately for a rebound from the support of 1.2275, counting on correction of 30-35 points by the end of the day.
To open short positions on GBPUSD, you need:
Sellers coped with the task for the first half of the day and did not let the pair above the resistance of 1.2389. However, the market is currently under the control of buyers of the pound, and it will be possible to talk about the continuation of the bear market only after the breakdown and consolidation below the support of 1.2342. This scenario will lead to a larger fall in the GBP/USD to the area of the lows of 1.2300 and 1.2275, where I recommend fixing the profits. The report on the US labor market may lead to another attempt by the bulls to get above the resistance of 1.2389, so it is best to open new short positions from there only after the formation of a false breakout. I recommend selling GBP/USD immediately for a rebound only after testing the highs of 1.2446 and 1.2478, based on an intraday correction of 30-40 points.
Signals of indicators:
Moving averages
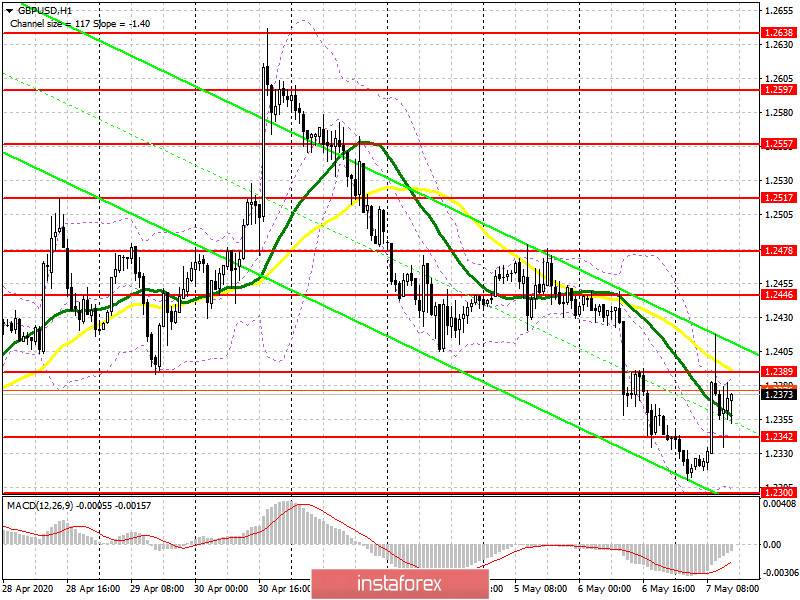
Trading is below the 30 and 50 daily averages, which indicates a further decline in the pound on the trend.
Note: The period and prices of moving averages are considered by the author on the hourly chart H1 and differ from the general definition of the classic daily moving averages on the daily chart D1.
Bollinger Bands
If the pound falls in the second half of the day, the lower border of the indicator around 1.2300 will provide support. Repeated testing of the upper limit of the indicator in the area of 1.2385 may lead to a larger increase in the pound.
Description of indicators
- Moving average (moving average determines the current trend by smoothing out volatility and noise). Period 50. The graph is marked in yellow.
- Moving average (moving average determines the current trend by smoothing out volatility and noise). Period 30. The graph is marked in green.
- MACD indicator (Moving Average Convergence / Divergence - moving average convergence / divergence) Fast EMA period 12. Slow EMA period 26. SMA period 9
- Bollinger Bands (Bollinger Bands). Period 20


