Hello, dear colleagues!
Today's review of the main currency pair of the Forex market will begin with the fact that the assumptions of a week ago about the possible growth of EUR/USD during trading on May 4-8 were not confirmed.
In the current situation, where the main attention of market participants is paid to the negative consequences of COVID-19 for the global economy, both macroeconomic indicators and technical components are often ignored. However, it is worth recalling the main event of last week, which was the data on the US labor market.
So, according to the United States Department of Labor, the world's leading economy did not count 20.5 million new jobs in April, although economists expected that employment in non-agricultural sectors of the American economy will fall by 22 million. The unemployment forecasts were very bleak and came down to 16%. In fact, unemployment rose to 14% in April, which is also a fairly high level. But the average hourly wage in the United States last month rose significantly above the forecast values of 0.4%, and amounted to 4.7%.
Thus, all three major labor indicators in the US turned out to be better than forecasts and should have supported the US currency. We will see what actually happened on the euro/dollar charts, but first, we will analyze the weekly timeframe.
Weekly

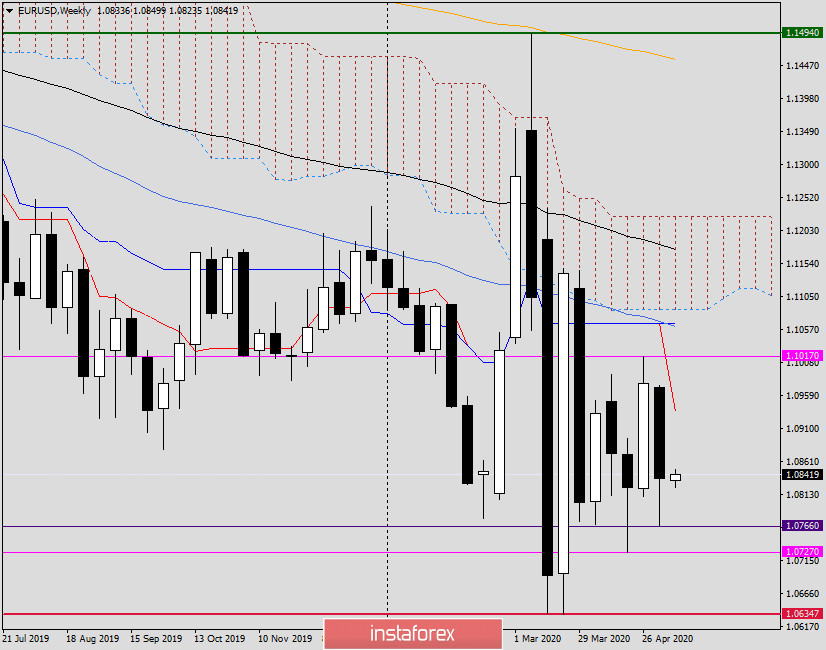
As already noted at the beginning of the article, the expected upward scenario was not confirmed, and the pair declined following the results of trading the last five days, losing 1.29%. If you look closely, the euro/dollar has been trading in the range of 1.1017-1.0727 for five consecutive weeks. The market can not determine the direction of price movement.
If there are attempts to go up from the indicated range, the nearest resistance may occur near 1.1065, where the Kijun line of the Ichimoku indicator and the 50 simple moving average are located. We can not exclude the possibility that meeting strong resistance in the area of 1.1065-1.1087, where the lower border of the weekly Ichimoku cloud passes, the pair will turn to decline and again fall below 1.1017. In this case, the breakdown of this level will be considered false.
Considering the bearish outlook for an exit from the range, after the breakout of support at 1.0727, the road to the next strong level of 1.0635 will open. At least, this timeframe does not show any obstacles to the implementation of such a scenario.
The census of the maximum values of the previous weekly trading at 1.0974 will most likely send the pair to test the level of 1.1017. If the bears manage to update the previous lows of 1.0766, we can expect to test for a breakdown of the lower limit of the range - the level of 1.0727.
Daily

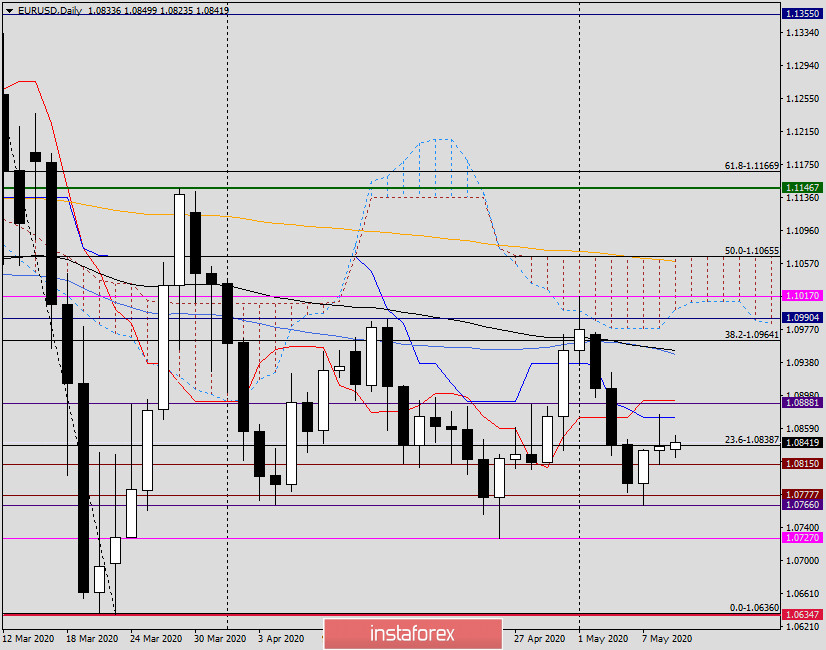
On the daily chart, the technical picture is also far from clear. After a three-day decline, the pair started to adjust from 1.0766. It is characteristic that even after the release of data on the US labor market, which exceeded analysts ' forecasts, the quote tried to continue growing. However, this was not to happen, strong resistance was provided by the Kijun line, which pushed the price down.
However, even overcoming Kijun will not solve all the problems of euro bulls. Then they need to pass the Tenkan, and even higher, near 1.0955, 50 simple and 89 exponential moving averages converged. But this is not all. All the seriousness of the bulls' intentions for the euro/dollar will be confirmed by the exit up from the daily Ichimoku cloud and the breakdown of the 200 EMA, after which they will have to once again test the resistance of sellers at 1.1146, where the trading highs were shown on March 27. Only after a true breakdown of the last mark can you expect to rise to higher prices. At this stage, the players have a lot of tasks to improve and they are quite difficult. Their opponents, the bears, are much simpler. These are the support levels of 1.0766 and 1.0727, after the breakdown of which, the road will open to the area of 1.0636, where the key support is held.
Conclusions and recommendations for EUR/USD:
Since the situation is ambiguous, it is worth considering both purchases and sales, which I will give the most preference to.
The nearest purchases can be considered from the price zone of 1.0830-1.0815, and below from the area of 1.0800-1.0780.
I recommend looking at the earliest sales after short-term rises in the areas of 1.0860-1.0895 and 1.0900-1.0920.
From the statistics, which this week may affect the price dynamics of EUR/USD, it is worth highlighting data from the US on retail sales, as well as the consumer price index; the Eurozone will provide reports on changes in GDP and industrial production. Let's talk in more detail about these and other events on the day of their release.
Good luck with trading!


