


Morgan Stanley stock price has enjoyed a big bull run from March 2020 when it was trading around $30 just after the COVID-19 outbreak. Now more than a year later, price has risen to $97-$100 and is showing reversal signs.
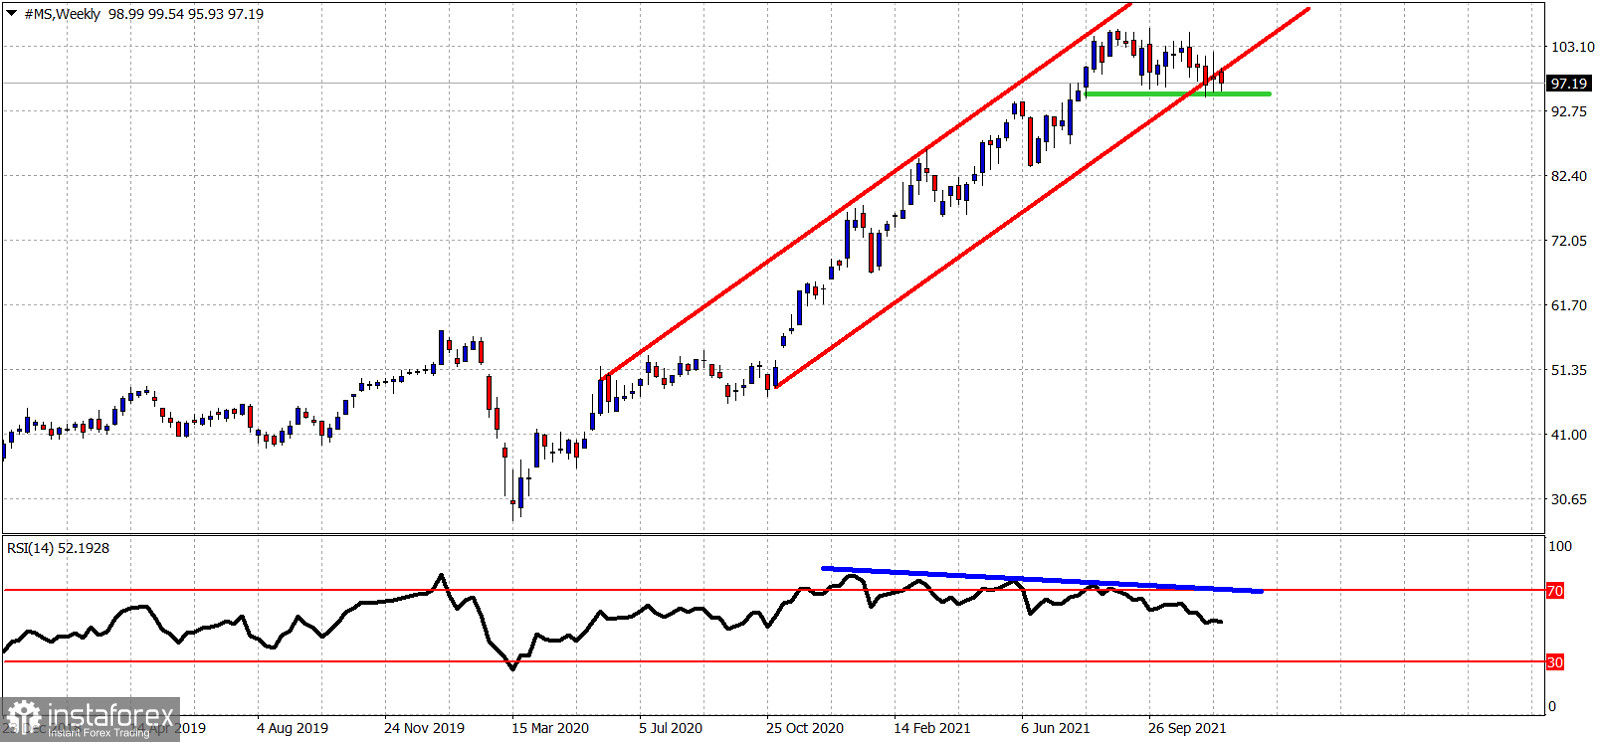
Red lines - bullish channel
Blue line- bearish divergence
Green line- horizontal support
Price has been trading inside the red upward sloping channel for some time. However recently price is moving mostly sideways and this has lead to an exit out of the bullish channel. This is the first warning regarding the stock price of Morgan Stanley. The second warning came from the weekly RSI. There is a bearish divergence given by the RSI. The RSI is not making higher highs and higher lows as the price does. The bearish divergence is an important warning but not a reversal signal. We could soon see a third bearish signal if price breaks below $95 on a weekly basis. This is important horizontal support and breaking below it will provide another bearish signal. Our first pull back target is at $83, if the horizontal support fails to hold. If this support is held and price breaks above $102, then we could see a new upward move starting that could push price to new all time highs.


