


Good day traders!
Yesterday, the British Prime Minister, who himself had been ill with COVID-19, addressed the House of Commons of the UK parliament in very cautious tones, reminding citizens to maintain utmost vigilance and limit contacts as much as possible. According to Johnson, any wrong move threatens to turn into a new outbreak of coronavirus infection.
Since the British government is considering lifting a number of restrictions, Prime Minister Johnson does not get tired of repeating the need to wash hands with soap as much as possible, as well as the use of protective masks and keeping social distance. There is nothing new in such calls, but a constant reminder is needed to avoid the further spread of the virus. According to official data, two million people were tested for COVID-19 in the UK, among which 220,000 tested positive.
No macroeconomic statistics are planned from the UK today. The main fundamental factor for the GBP/USD pair will be the US consumer price index, which will be published at 13:30 (UTC+1). A preliminary data on UK GBP for the first quarter will be published tomorrow at 7:00 (UTC+1).
Daily
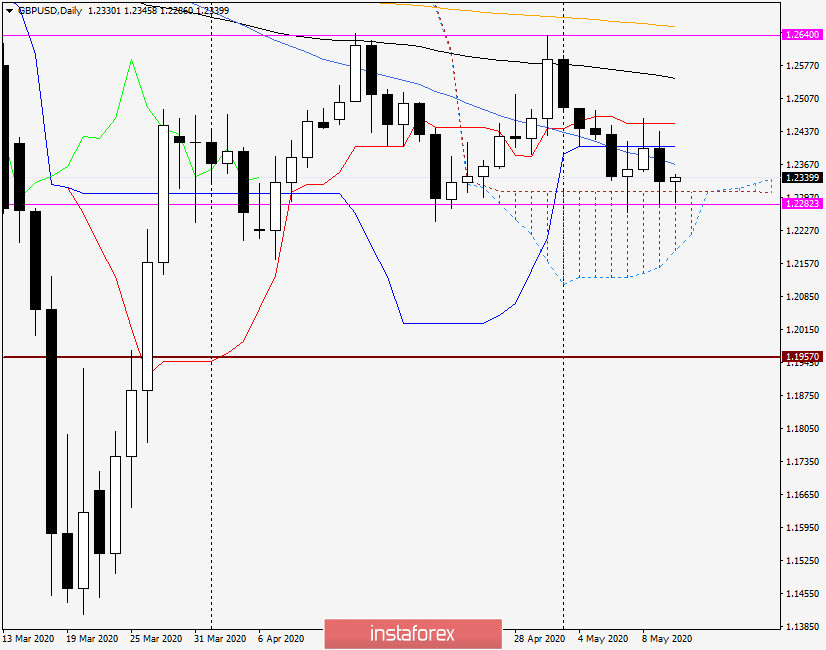
There were no significant changes in the technical picture of the GBP./USD pair yesterday despite the decline recorded. Strong support is still provided by the upper border of the Ichimoku cloud, which does not allow the quotes to fall within its (cloud) limits. Although the quotes fell, it immediately bounced up, leaving only tails inside the cloud (lower shadows).
Attempts of an upward movement met a strong resistance in the price zone 1.2367-1.2453, where the 50 SMA, Kijun and Tenkan lines are located. A breakthrough of the price zone does not guarantee bulls an easy walk upwards. The 89 EMA (black) is ready to provide resistance at the price level of 1.2550. Meanwhile, 200 EMA is rising threateningly above the 1.2640 resistance.
Bullish mood will occur after a true breakdown of 200 EMA, while bearish mood will occur if quotes go down from the Ichimoku cloud. The situation in the daily chart is unclear at the moment.
H4
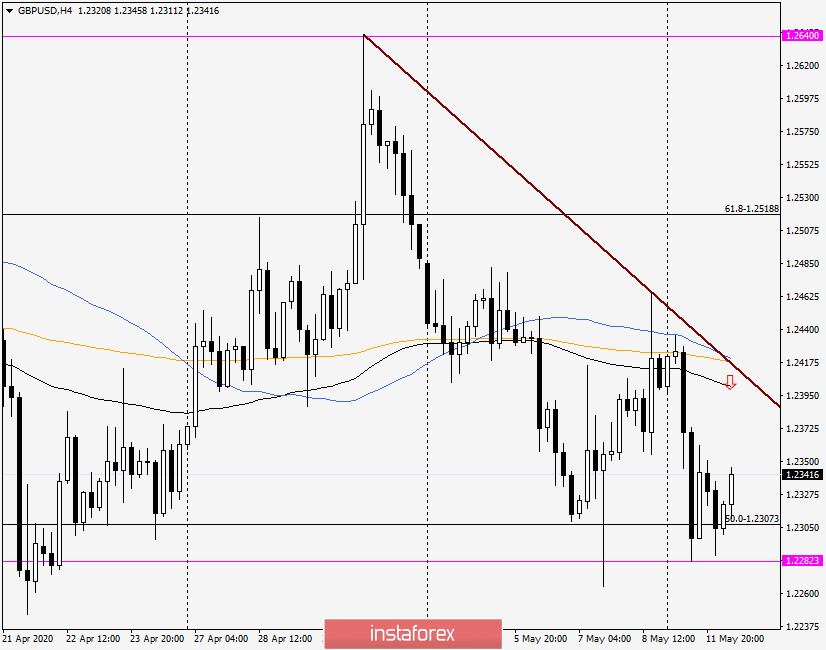
The situation on the four-hour chart is clearer. Signals point to the opening of sell positions, after quotes rise to the price range of 1.2400-1.2430. In addition to the brown resistance line drawn at the points 1.2641-1.2465, the 89 EMA, 200 EMA and 50 MA have accumulated there as well.
Trading recommendations for GBP / USD:
Open sell positions when quotes enter the area of 1.2400-1.2420. Additional signals are candlestick patterns that indicate a decrease. Set goals in the price zone 1.2310-1.2300.
In case of an upward movement and break of the brown resistance line and all the moving averages used, wait for quotes to consolidate above, before opening buy positions at a rollback, with goals in the range of 1.2500-1.2515.
Good luck!


