


To open long positions on GBPUSD, you need:
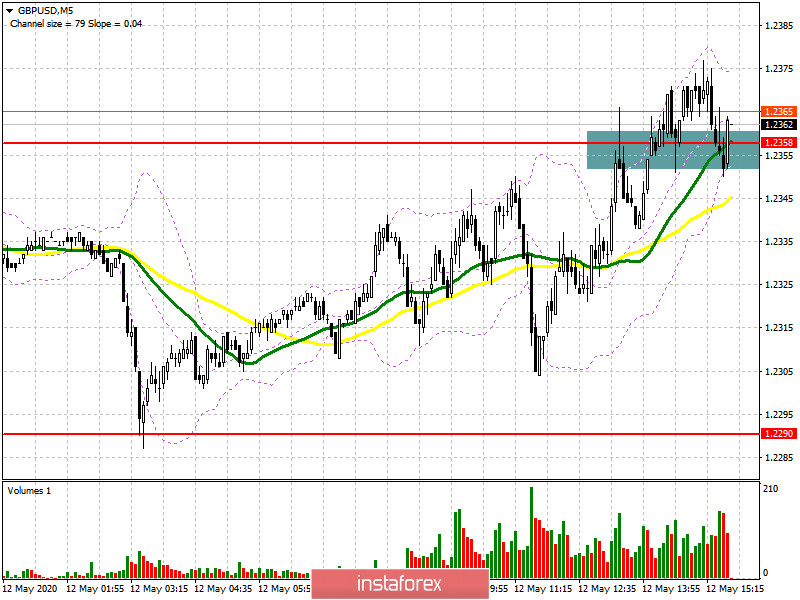
If you look at the 5-minute chart, we see the sellers tried to resume the downward movement of the pound in the continuation of the trend after the resistance update 1.2358, but this did not lead to a serious sale, but only led to the trading in this area, with a change of direction in favor of the bullish. Now buyers are trying to hold the level of 1.2358, but they are not doing very well. We urgently need to reach a new maximum of 1.2425, as if this does not happen soon, the pressure on the pound may return. The longer-term goal of buyers of GBP/USD remains the resistance of 1.2463, where I recommend fixing the profits. If the pressure on the pound returns in the second half of the day, and according to the report, which indicated a worse situation with inflation in the US than expected, it is best to postpone long positions until the support test of 1.2290 or open long positions immediately on a rebound from the minimum of 1.2250 in the expectation of correction of 30-40 points by the close of the day.
To open short positions on GBPUSD, you need:
The bears tried to fight for the resistance of 1.2358, but nothing good came out of it in the first half of the day. If you look at the 5-minute chart, you can see how sellers again need to return to this range, which can lead to a larger sale of GBP/USD with a return to the minimum of a day in the area of 1.2290, where I recommend fixing the profits. The longer-term goal will be the area of 1.2250, the test of which will indicate the continuation of the bearish trend. If the pressure on the pound is not formed from the level of 1.2358, sellers can retreat to a larger resistance of 1.2425, from where I recommend opening short positions immediately for a rebound in the expectation of a downward correction of 30-40 points within the day.
Signals of indicators:
Moving averages
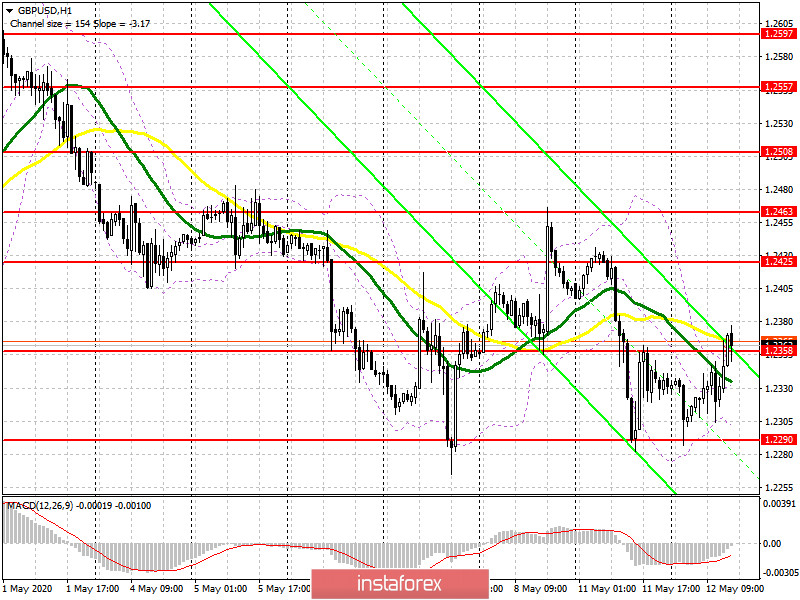
Trading is conducted around 30 and 50 daily averages, which indicates some market uncertainty with the future direction.
Note: The period and prices of moving averages are considered by the author on the hourly chart H1 and differ from the general definition of the classic daily moving averages on the daily chart D1.
Bollinger Bands
It has not yet been possible to break above the upper limit of the indicator in the area of 1.2360. A breakdown of the lower border in the area of 1.2300 will only increase the pressure on the pound.
Description of indicators
- Moving average (moving average determines the current trend by smoothing out volatility and noise). Period 50. The graph is marked in yellow.
- Moving average (moving average determines the current trend by smoothing out volatility and noise). Period 30. The graph is marked in green.
- MACD indicator (Moving Average Convergence / Divergence - moving average convergence / divergence) Fast EMA period 12. Slow EMA period 26. SMA period 9
- Bollinger Bands (Bollinger Bands). Period 20


