


To open long positions on EURUSD, you need:
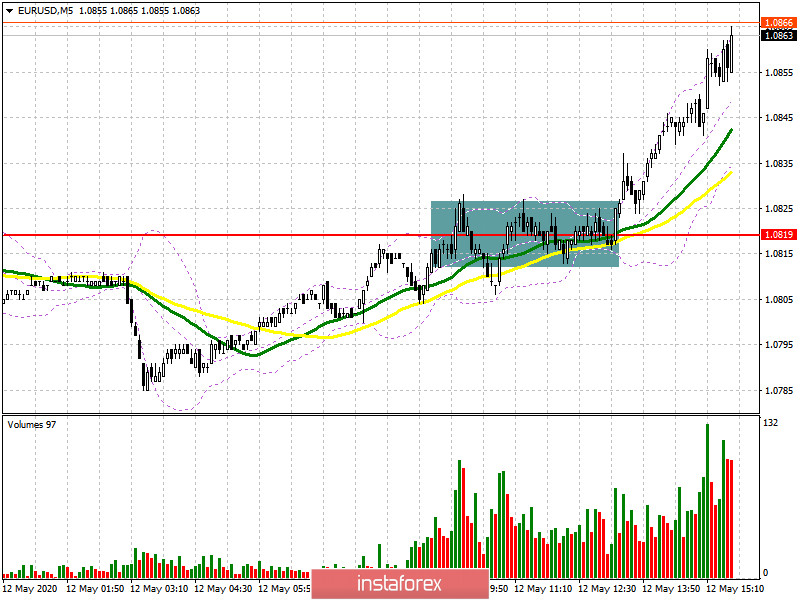
If we look closely at the 5-minute chart, we will see that after the first resistance test of 1.0819, nothing changed in the market, and buyers chose not to force events and postponed their return until the publication of the inflation report, which also has not yet led to the movement of EUR/USD down even against the background of worse indicators than expected by economists. Consolidation at 1.0819 occurred closer to the second half of the day, but there was no desired test of this level from the top down on the volume. So anyone who missed this deal should not be upset, you did everything right. At the moment, the bulls are gradually getting closer to the resistance of 1.0873, where certain difficulties may begin. The task for the second half of the day will be to break through and consolidate above this range, which will lead to a larger increase in EUR/USD already in the area of the maximum of 1.0923, where I recommend fixing the profits. However, it is more interesting to enter long positions after a downward correction to the area of the morning (support of 1.0819), from where you can buy immediately on the rebound.
To open short positions on EURUSD, you need:
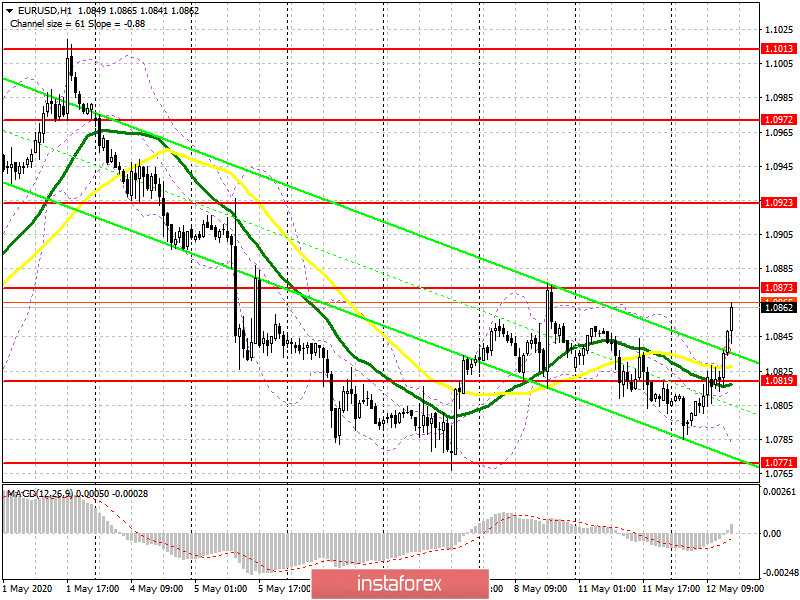
Bears need to protect the resistance of 1.0873. Only the formation of a false breakout on it will be a signal to open short positions in the expectation of a downward correction to the support area of 1.0819, where I recommend fixing the profits since everything is going to change the short-term trend to an upward one. The euro sellers were not helped by rather poor data on US inflation, which slowed more than expected. If there is no activity from the bears at this level, it is best to postpone sales immediately to rebound from the resistance of 1.0923 with the goal of correction of 30-35 points within the day. An equally important task for bears will be to close the day below the level of 1.0819, which will indicate the real presence of major players in the market, who expect to update the annual lows in the near future.
Signals of indicators:
Moving averages
Trading is conducted above the 30 and 50 daily moving averages, which indicates a possible change in the short-term trend.
Note: The period and prices of moving averages are considered by the author on the hourly chart H1 and differ from the general definition of the classic daily moving averages on the daily chart D1.
Bollinger Bands
If the pair declines in the second half of the day, you can open long positions on a rebound from the average border of the indicator around 1.0819.
Description of indicators
- Moving average (moving average determines the current trend by smoothing out volatility and noise). Period 50. The graph is marked in yellow.
- Moving average (moving average determines the current trend by smoothing out volatility and noise). Period 30. The graph is marked in green.
- MACD indicator (Moving Average Convergence / Divergence - moving average convergence / divergence) Fast EMA period 12. Slow EMA period 26. SMA period 9
- Bollinger Bands (Bollinger Bands). Period 20


